概述
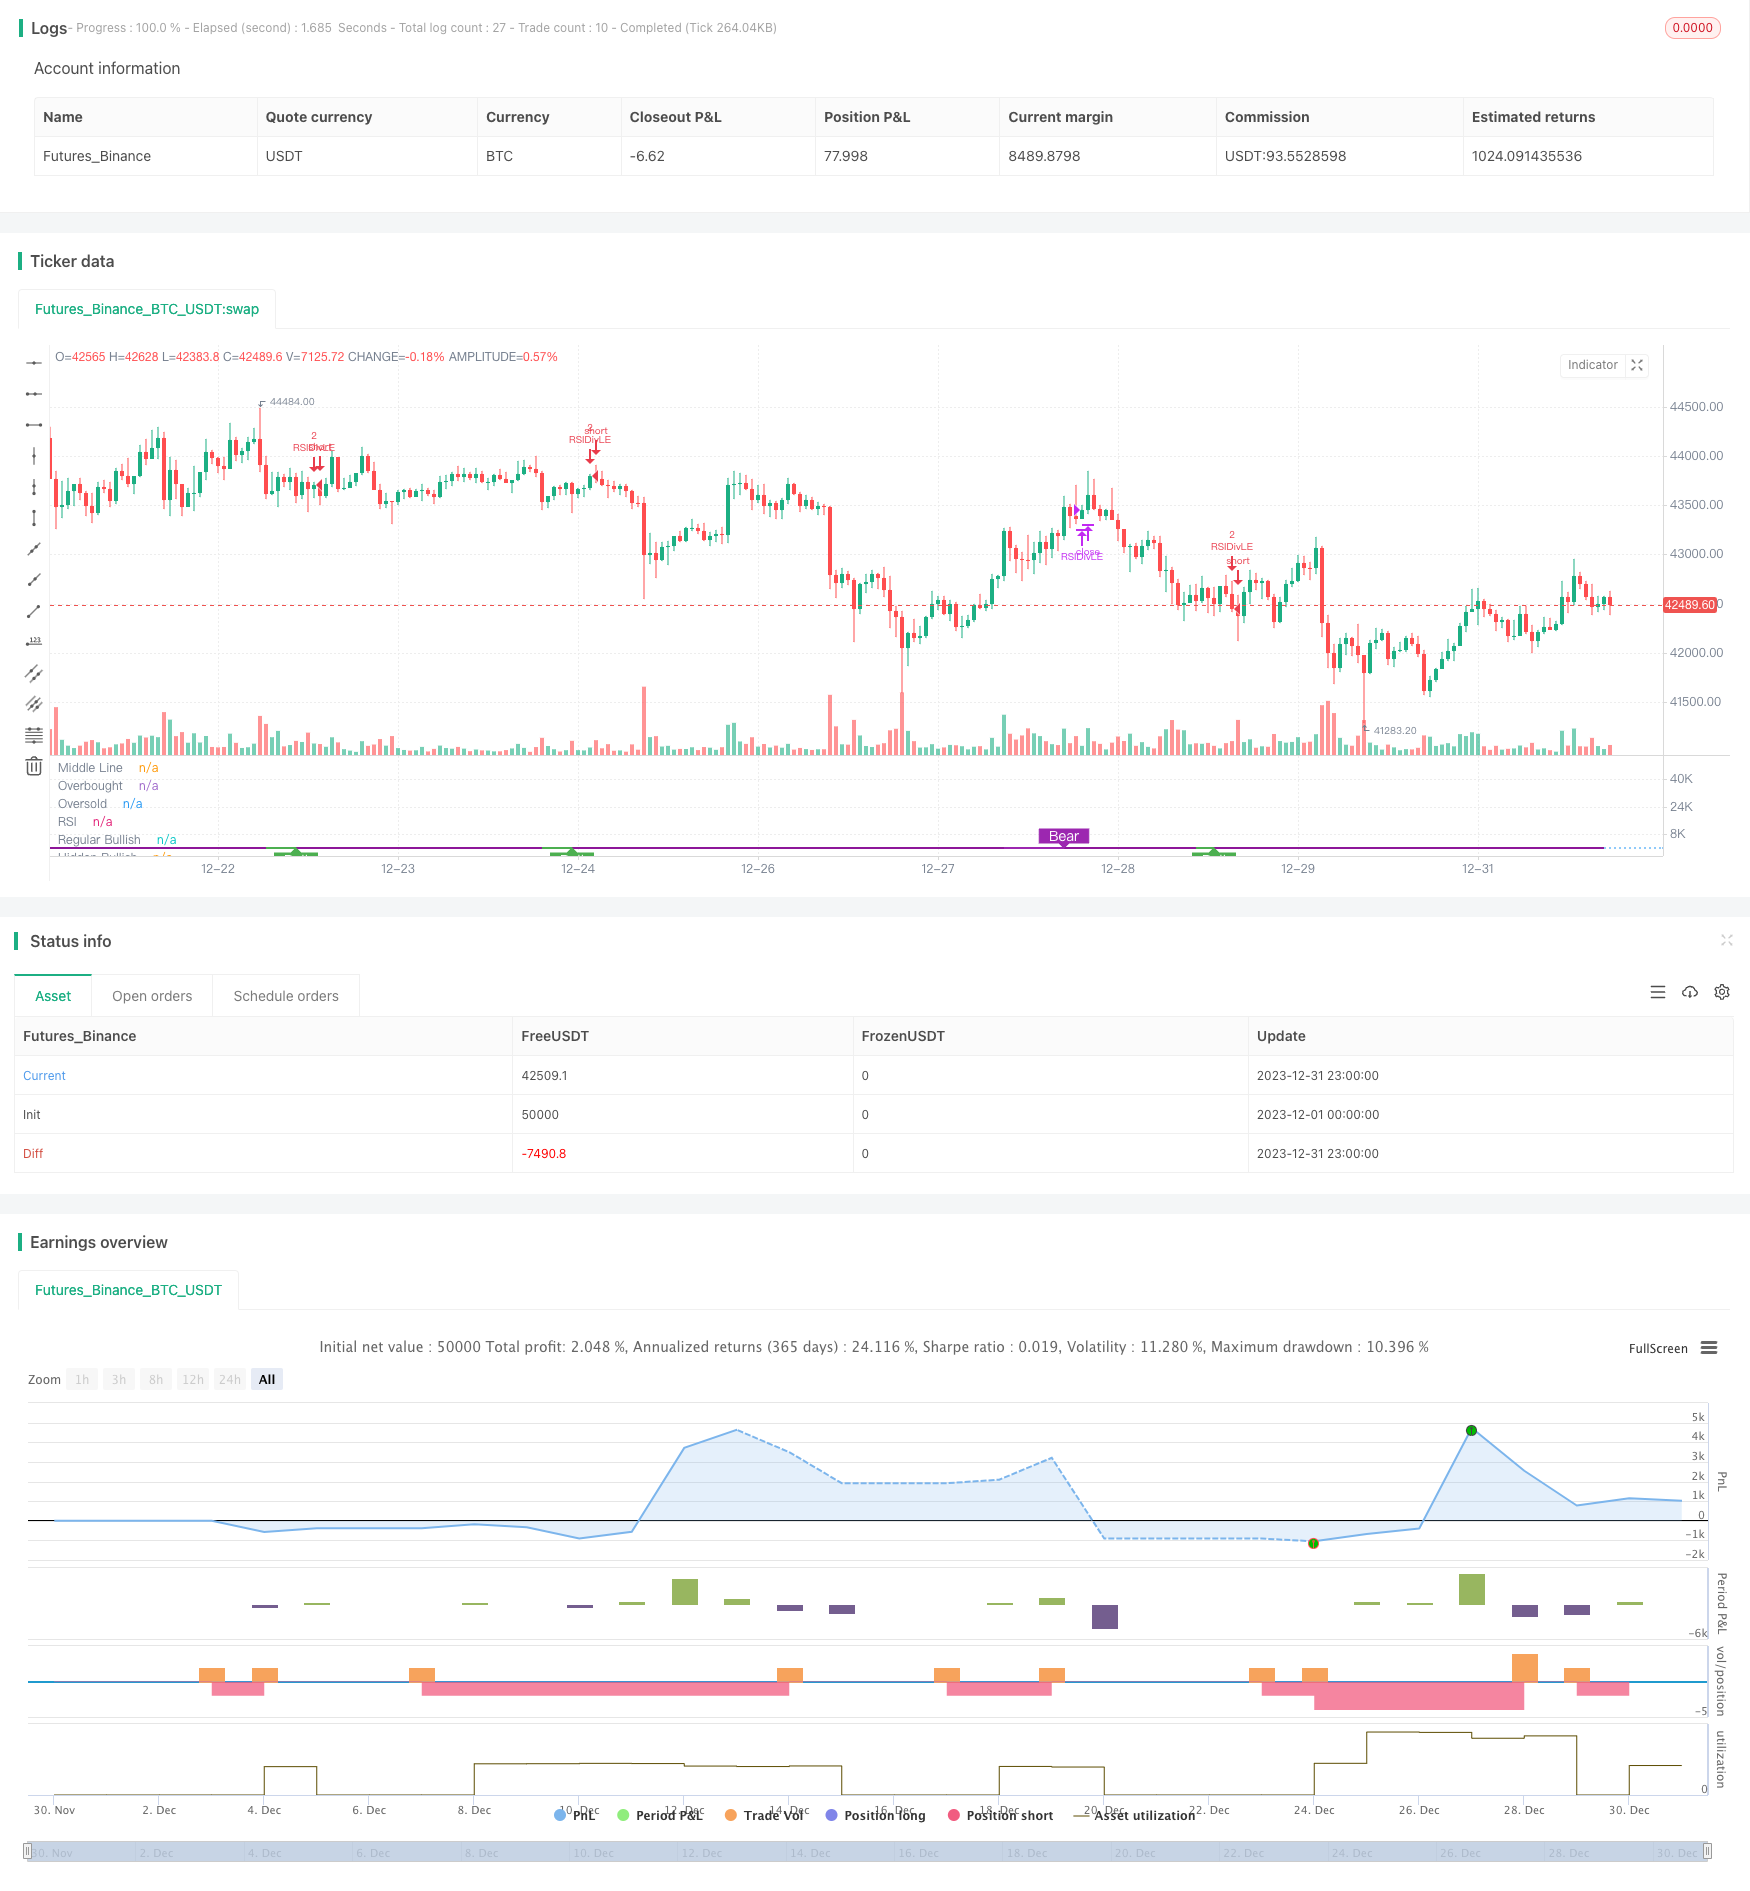
RSI多空分歧指标是一种基于相对强弱指标(RSI)的量化交易策略。它通过分析RSI指标与价格之间的分歧,发现价格趋势反转的机会,实现低买高卖的目的。
策略原理
该策略的核心指标是RSI。它分析RSI指标与价格之间的“分歧”。所谓“分歧”,就是RSI指标和价格之间出现反向信号。
具体来说,当RSI形成较低的低点,而价格形成较高的低点时,就是RSI与价格之间的多头分歧。这预示着价格可能反转上涨。策略会在这个时点建立多头仓位。
相反,当RSI形成较高的高点,而价格形成较低的高点时,就是RSI与价格之间的空头分歧。这预示着价格可能反转下跌。策略会在这个时点建立空头仓位。
通过捕捉RSI与价格之间的这些分歧点,策略能及时发现价格反转机会,实现低买高卖。
策略优势
RSI多空分歧策略具有以下优势:
捕捉价格反转点精准。RSI与价格分歧往往预示着即将发生的趋势反转,是非常有效的预测信号。
实现低买高卖。通过分歧点建仓,能够在相对低点买入,在相对高点卖出,符合量化交易的最佳实践。
突破常规RSI策略局限性。常规RSI策略只关注超买超卖区域。而该策略则利用RSI指标本身的反转属性,以更精准的方式捕捉转折点。大大提高了策略的效率。
简单的参数设定。主要参数只有RSI周期和回看区间两个,非常简单,容易优化。
策略风险
RSI多空分歧策略也存在一定的风险:
分歧信号可能是假信号。RSI与价格之间的分歧不一定会导致真实的价格反转。有时也会形成假反转。这会导致交易亏损。可以适当设定止损来控制风险。
在趋势市场中表现不佳。当股价出现方向明确的趋势行情时,该策略的获利空间会比较小。这种情况下,最好暂时停用该策略,等待新的震荡行情。
复利风险。策略设置了复利参数,如果遇到多次亏损交易,可能会加速账户损失。这需要控制仓位规模和止损点来降低风险。
策略优化
该策略还可以从以下几个方面进行优化:
结合其他指标过滤信号。可以加入MACD,KDJ等其他指标,对RSI分歧点进行验证,过滤掉一些假信号,提高策略胜率。
优化RSI参数。可以测试不同的RSI周期参数,找到更匹配品种特点的RSI周期设置。一般在6-15之间效果较好。
优化回看区间。回看区间直接影响到策略的交易频率。可以测试不同的参数,找到最佳的频率。一般在5-15之间效果较好。
增加止损策略。可以根据ATR,移动止损等方式,设定合理的止损逻辑。在出现亏损时快速止损,可以有效控制策略风险。
总结
RSI多空分歧策略通过分析RSI指标本身的反转属性,精准捕捉价格变化的转折点。实现了低买高卖的交易策略。相比于传统意义的RSI超买超卖策略,它使用了更精细和原始的RSI特征,大大提高了策略的效率。配合参数优化和风险控制,它非常适合用来捕捉震荡行情中的短线交易机会。
/*backtest
start: 2023-12-01 00:00:00
end: 2023-12-31 23:59:59
period: 1h
basePeriod: 15m
exchanges: [{"eid":"Futures_Binance","currency":"BTC_USDT"}]
*/

//@version=4
//study(title="Divergence Indicator", format=format.price)
//GOOGL setting  5 , close, 3 , 1  profitLevel at 75 shows win rate  87.21 %  profit factor 7.059
//GOOGL setting  8 , close, 3 , 1  profitLevel at 80 shows win rate  86.57 %  profit factor 18.96
//SPY setting    5, close , 3, 3  profitLevel at 70  , shows win rate 80.34%  profit factor 2.348
strategy(title="RSI Divergence Indicator", overlay=false,pyramiding=2, default_qty_value=2,   default_qty_type=strategy.fixed, initial_capital=10000, currency=currency.USD)

len = input(title="RSI Period", minval=1, defval=9)
src = input(title="RSI Source", defval=close)
lbR = input(title="Pivot Lookback Right", defval=3)
lbL = input(title="Pivot Lookback Left", defval=1)
takeProfitRSILevel = input(title="Take Profit at RSI Level", minval=70, defval=80)

rangeUpper = input(title="Max of Lookback Range", defval=60)
rangeLower = input(title="Min of Lookback Range", defval=5)
plotBull = input(title="Plot Bullish", defval=true)
plotHiddenBull = input(title="Plot Hidden Bullish", defval=true)
plotBear = input(title="Plot Bearish", defval=true)
plotHiddenBear = input(title="Plot Hidden Bearish", defval=false)

//useTrailStopLoss = input(false, title="Use Trailing Stop Loss")

sl_type = input("NONE", title="Trailing StopLoss Type", options=['ATR','PERC', 'NONE'])

stopLoss = input(title="Stop Loss%", defval=5, minval=1)

atrLength=input(14, title="ATR Length (for Trailing stop loss)")
atrMultiplier=input(3.5, title="ATR Multiplier (for Trailing stop loss)")


bearColor = color.purple
bullColor = color.green
hiddenBullColor = color.new(color.green, 80)
hiddenBearColor = color.new(color.red, 80)
textColor = color.white
noneColor = color.new(color.white, 100)

osc = rsi(src, len)

plot(osc, title="RSI", linewidth=2, color=#8D1699)
hline(50, title="Middle Line", linestyle=hline.style_dotted)
obLevel = hline(70, title="Overbought", linestyle=hline.style_dotted)
osLevel = hline(30, title="Oversold", linestyle=hline.style_dotted)
fill(obLevel, osLevel, title="Background", color=#9915FF, transp=90)

plFound = na(pivotlow(osc, lbL, lbR)) ? false : true
phFound = na(pivothigh(osc, lbL, lbR)) ? false : true

_inRange(cond) =>
    bars = barssince(cond == true)
    rangeLower <= bars and bars <= rangeUpper

//------------------------------------------------------------------------------
// Regular Bullish

// Osc: Higher Low
oscHL = osc[lbR] > valuewhen(plFound, osc[lbR], 1) and _inRange(plFound[1])

// Price: Lower Low
priceLL = low[lbR] < valuewhen(plFound, low[lbR], 1)

bullCond = plotBull and priceLL and oscHL and plFound

plot(
	 plFound ? osc[lbR] : na,
	 offset=-lbR,
	 title="Regular Bullish",
	 linewidth=2,
	 color=(bullCond ? bullColor : noneColor),
	 transp=0
	 )


plotshape(
	 bullCond ? osc[lbR] : na,
	 offset=-lbR,
	 title="Regular Bullish Label",
	 text=" Bull ",
	 style=shape.labelup,
	 location=location.absolute,
	 color=bullColor,
	 textcolor=textColor,
	 transp=0
	 )

//------------------------------------------------------------------------------
// Hidden Bullish

// Osc: Lower Low
oscLL = osc[lbR] < valuewhen(plFound, osc[lbR], 1) and _inRange(plFound[1])

// Price: Higher Low
priceHL = low[lbR] > valuewhen(plFound, low[lbR], 1)

hiddenBullCond = plotHiddenBull and priceHL and oscLL and plFound

plot(
	 plFound ? osc[lbR] : na,
	 offset=-lbR,
	 title="Hidden Bullish",
	 linewidth=2,
	 color=(hiddenBullCond ? hiddenBullColor : noneColor),
	 transp=0
	 )

plotshape(
	 hiddenBullCond ? osc[lbR] : na,
	 offset=-lbR,
	 title="Hidden Bullish Label",
	 text=" H Bull ",
	 style=shape.labelup,
	 location=location.absolute,
	 color=bullColor,
	 textcolor=textColor,
	 transp=0
	 )

longCondition=bullCond or hiddenBullCond
//? osc[lbR] : na
//hiddenBullCond
strategy.entry(id="RSIDivLE", long=true,  when=longCondition)


//Trailing StopLoss
////// Calculate trailing SL
/////////////////////////////////////////////////////
sl_val = sl_type == "ATR"      ? stopLoss * atr(atrLength) :
         sl_type == "PERC" ? close * stopLoss / 100 : 0.00

trailing_sl = 0.0
trailing_sl :=   strategy.position_size>=1 ?  max(low  - sl_val, nz(trailing_sl[1])) :  na

//draw initil stop loss
//plot(strategy.position_size>=1 ? trailing_sl : na, color = color.blue , style=plot.style_linebr,  linewidth = 2, title = "stop loss")
//plot(trailing_sl, title="ATR Trailing Stop Loss", style=plot.style_linebr, linewidth=1, color=color.purple, transp=30)
//Trailing StopLoss
////// Calculate trailing SL
/////////////////////////////////////////////////////


//------------------------------------------------------------------------------
// Regular Bearish

// Osc: Lower High
oscLH = osc[lbR] < valuewhen(phFound, osc[lbR], 1) and _inRange(phFound[1])

// Price: Higher High
priceHH = high[lbR] > valuewhen(phFound, high[lbR], 1)

bearCond = plotBear and priceHH and oscLH and phFound

plot(
	 phFound ? osc[lbR] : na,
	 offset=-lbR,
	 title="Regular Bearish",
	 linewidth=2,
	 color=(bearCond ? bearColor : noneColor),
	 transp=0
	 )

plotshape(
	 bearCond ? osc[lbR] : na,
	 offset=-lbR,
	 title="Regular Bearish Label",
	 text=" Bear ",
	 style=shape.labeldown,
	 location=location.absolute,
	 color=bearColor,
	 textcolor=textColor,
	 transp=0
	 )

//------------------------------------------------------------------------------
// Hidden Bearish

// Osc: Higher High
oscHH = osc[lbR] > valuewhen(phFound, osc[lbR], 1) and _inRange(phFound[1])

// Price: Lower High
priceLH = high[lbR] < valuewhen(phFound, high[lbR], 1)

hiddenBearCond = plotHiddenBear and priceLH and oscHH and phFound

plot(
	 phFound ? osc[lbR] : na,
	 offset=-lbR,
	 title="Hidden Bearish",
	 linewidth=2,
	 color=(hiddenBearCond ? hiddenBearColor : noneColor),
	 transp=0
	 )

plotshape(
	 hiddenBearCond ? osc[lbR] : na,
	 offset=-lbR,
	 title="Hidden Bearish Label",
	 text=" H Bear ",
	 style=shape.labeldown,
	 location=location.absolute,
	 color=bearColor,
	 textcolor=textColor,
	 transp=0
	 )
longCloseCondition=crossover(osc,takeProfitRSILevel) or bearCond
strategy.close(id="RSIDivLE", comment="Close All="+tostring(close - strategy.position_avg_price, "####.##"), when= abs(strategy.position_size)>=1  and  sl_type == "NONE" and longCloseCondition)

//close all on stop loss
strategy.close(id="RSIDivLE", comment="TSL="+tostring(close - strategy.position_avg_price, "####.##"),  when=abs(strategy.position_size)>=1 and (sl_type == "PERC"   or sl_type == "ATR" ) and crossunder(close, trailing_sl)  )  //close<ema55 and rsi5Val<20 //ema34<ema55  //close<ema89


// Calculate start/end date and time condition
startDate  = input(timestamp("2019-01-01T00:00:00"), type = input.time)
finishDate = input(timestamp("2021-01-01T00:00:00"), type = input.time)

time_cond  = time >= startDate and time <= finishDate