概述
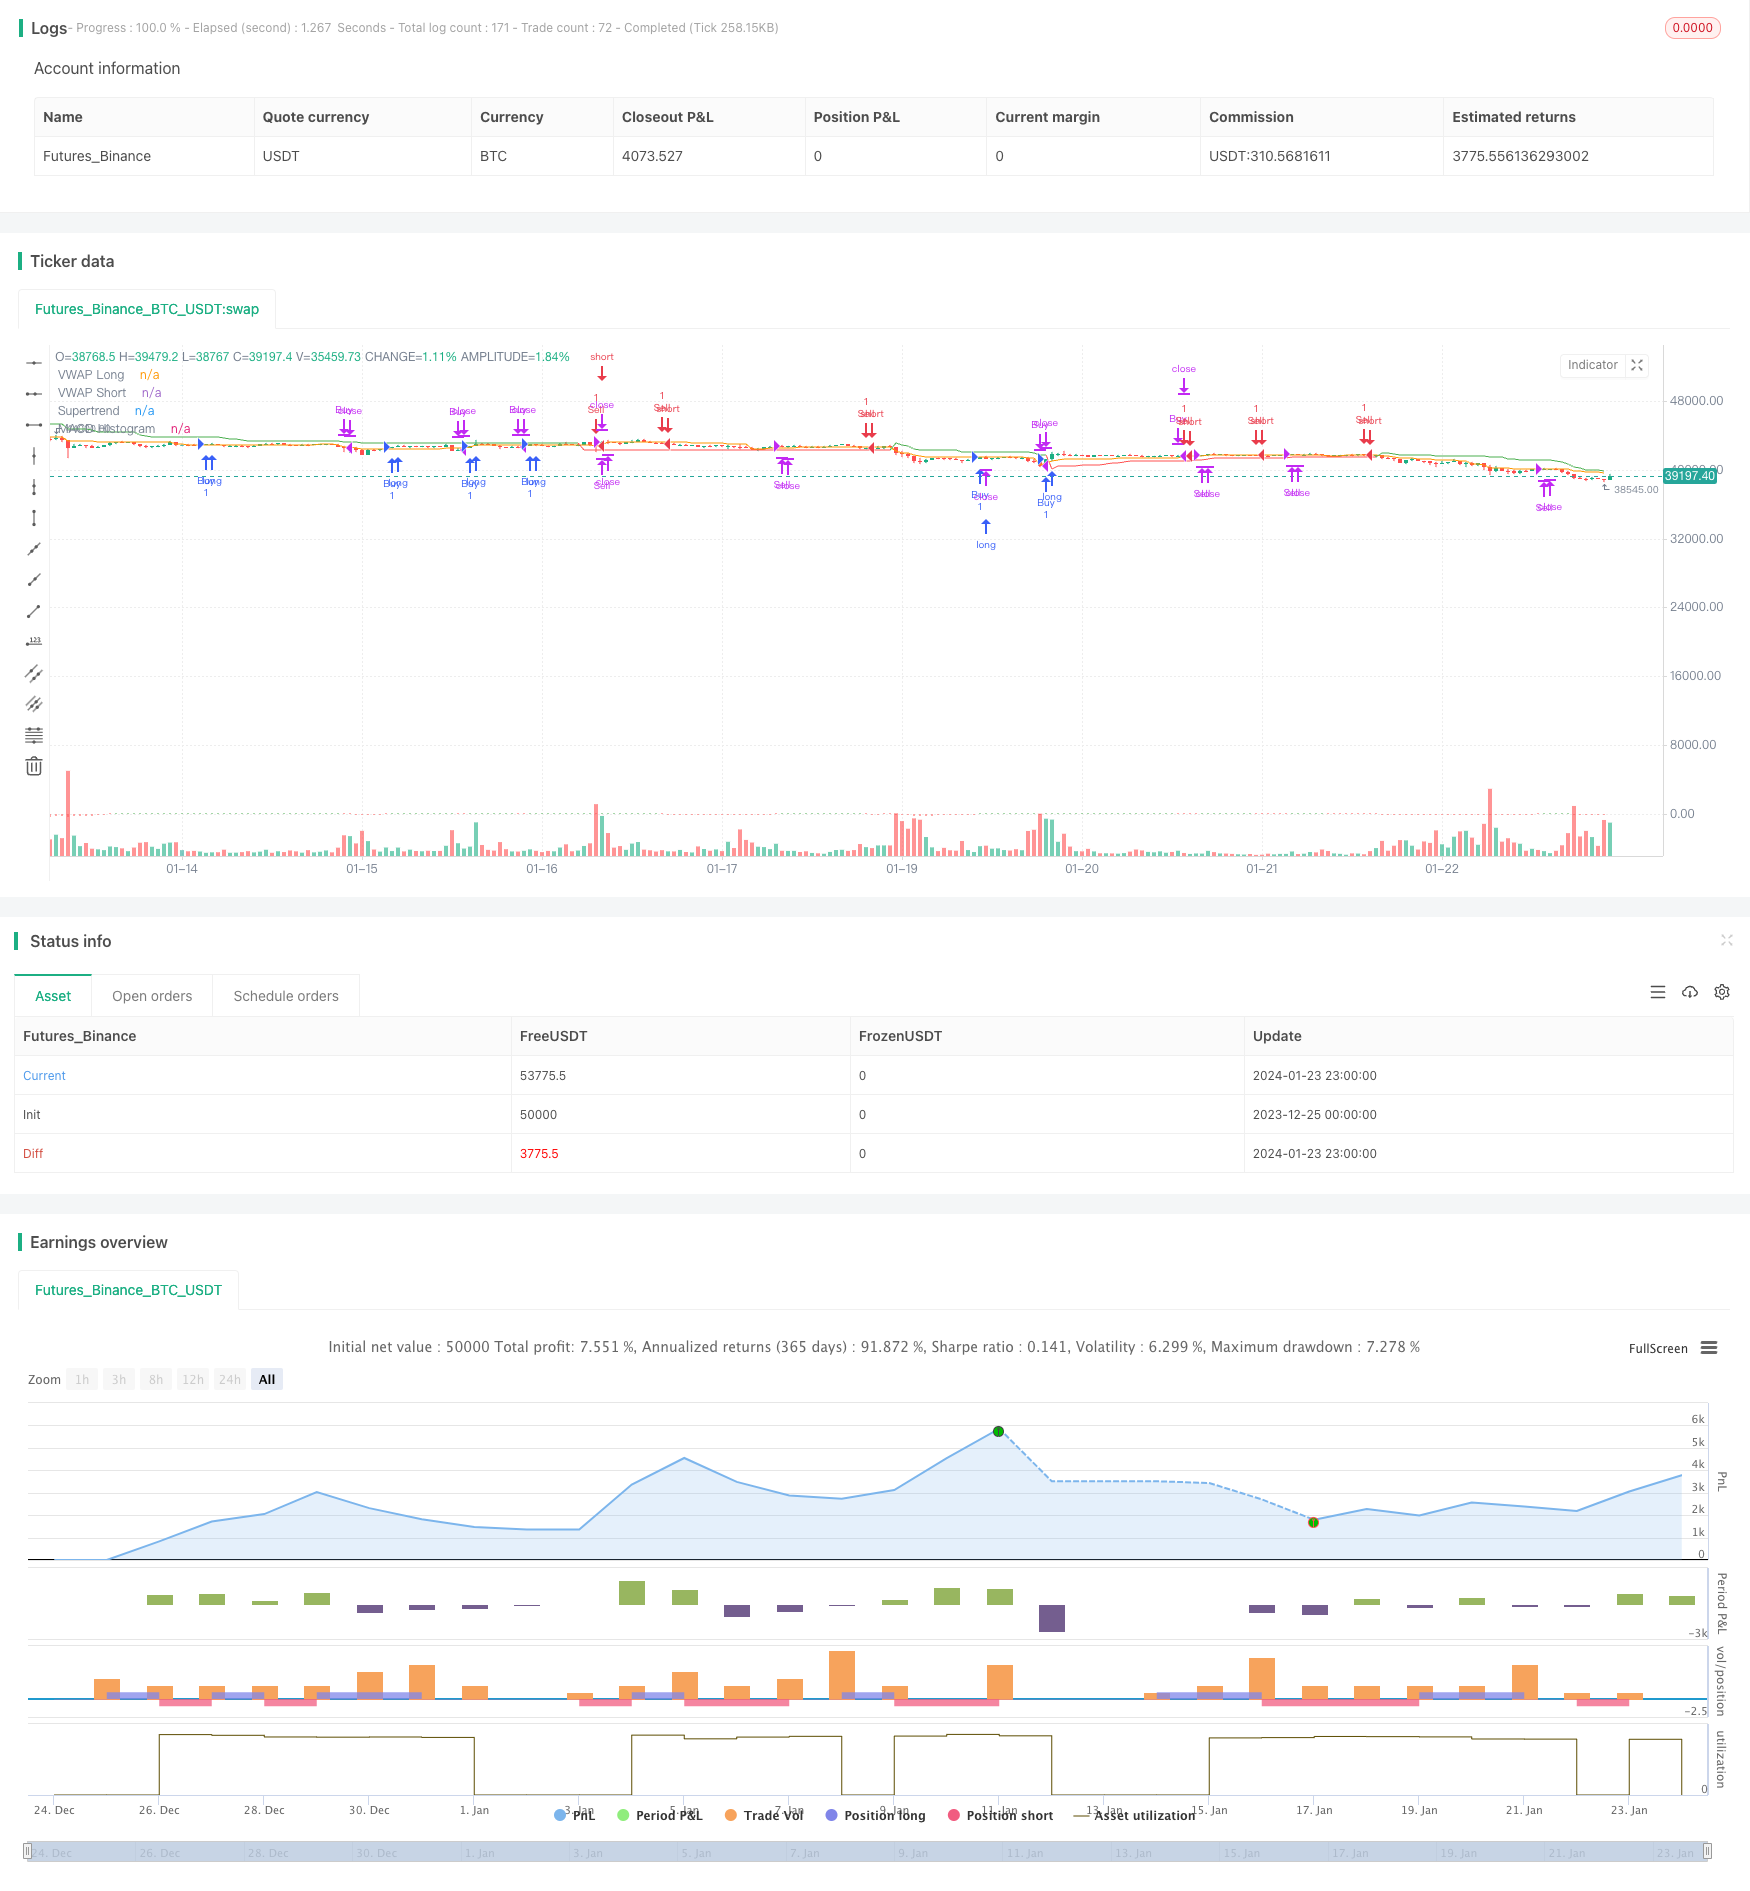
本策略融合了超级趋势指标、移动平均聚散指标和成交量加权平均价三个技术指标,旨在通过确认趋势方向和考虑价格与成交量加权平均价的接近程度,识别潜在的入场和退出点。该策略还结合了止损、止盈机制以及追踪止损来锁定利润。
策略原理
入场条件
趋势确认:策略使用超级趋势指标和MACD指标来确认趋势方向。双重确认可以提高准确识别趋势的可能性,过滤掉错误信号。
VWAP确认:策略会考虑价格与成交量加权平均价的接近程度。该动态水平可作为支持或阻力,为入场决策提供额外依据。
退出条件
MACD交叉:当MACD指标线和信号线发生向下交叉时,平仓做多头仓位;当指标线和信号线向上交叉时,平仓做空头仓位。
风险管理
自适应止损:策略设置了一个止损区间,可以容忍少量价格波动。这种自适应方法考虑了市场波动性,有助于防止止损过早触发。
追踪止损:策略加入了追踪止损机制来锁定利润,当交易朝着预期方向移动时,可以潜在提高盈利能力。
优势分析
双指标确认:超级趋势指标和MACD指标的组合确认趋势,这是该策略的一个独特之处。它为入场信号增加了过滤层,提高了准确性。
动态VWAP:将成交量加权平均价纳入决策过程中增加了策略的动态性。VWAP常被机构交易者使用,其引入可以提供市场情绪的见解。
自适应止损和追踪止损:策略采用自适应止损区间和追踪止损可以在变化的市场环境中更有效地管理风险和保护利润。
部分止盈:建议在MACD指标发生反向交叉时考虑部分止盈,这是采取实际方法来确保利润的同时保持仓位。
风险分析
回测:在实际交易中应用任何策略之前,有必要在历史数据上全面回测,以了解其在各种市场条件下的表现。
风险管理:虽然策略内置了风险管理机制,但仍有必要仔细管理仓位大小和整体投资组合的风险。
市场条件:没有哪种策略适用于所有市场条件。重要的是要灵活变通,在特别动荡或不可预测的时期调整策略或避免交易。
持续监控:即使策略包含了自动化组件,也有必要持续监控交易和市场状况。
适应性:市场随时间变化。交易者需要准备随时根据变化的市场动力调整策略。
优化方向
多时间框架:可以在更高的时间框架上应用该策略,利用更长期的趋势。
参数优化:可以测试不同的参数组合,例如ATR周期长度、止损范围等,寻找最佳参数。
部分止盈:可以设置更明确的部分止盈规则,例如在特定百分比收益时止盈。
条件优化:可以测试添加或删除某些入场或退出条件,找到条件组合的最佳平衡。
总结
本策略成功结合了趋势、动量和成交量指标,提供了一个相对独特的方法来确认趋势并识别潜在的入场点。双重确认和动态止损等特性使其具有一定优势。但任何策略都需要仔细回测、优化和监控,才能长期有效。该策略提供了一个值得探索和进一步完善的框架。
/*backtest
start: 2023-12-25 00:00:00
end: 2024-01-24 00:00:00
period: 1h
basePeriod: 15m
exchanges: [{"eid":"Futures_Binance","currency":"BTC_USDT"}]
*/

//@version=5
strategy("Trend Confirmation Strategy", overlay=true)

// Supertrend Indicator
atrPeriod = input(10, "ATR Length")
factor = input.float(3.0, "Factor", step = 0.01)
[supertrend, direction] = ta.supertrend(factor, atrPeriod)

// MACD Indicator
fast_length = input(title="Fast Length", defval=12)
slow_length = input(title="Slow Length", defval=26)
macd_src = input(title="Source", defval=close)
signal_length = input.int(title="Signal Smoothing",  minval = 1, maxval = 50, defval = 9)
macd_sma_source = input.string(title="Oscillator MA Type",  defval="EMA", options=["SMA", "EMA"])
macd_sma_signal = input.string(title="Signal Line MA Type", defval="EMA", options=["SMA", "EMA"])

fast_ma = macd_sma_source == "SMA" ? ta.sma(macd_src, fast_length) : ta.ema(macd_src, fast_length)
slow_ma = macd_sma_source == "SMA" ? ta.sma(macd_src, slow_length) : ta.ema(macd_src, slow_length)
macd = fast_ma - slow_ma
signal = macd_sma_signal == "SMA" ? ta.sma(macd, signal_length) : ta.ema(macd, signal_length)

// VWAP Indicator
vwap_hideonDWM = input(false, title="Hide VWAP on 1D or Above")
vwap_src = input(title="VWAP Source", defval=hlc3)

vwap_value = ta.vwap(vwap_src)
vwap_value_long = vwap_value
vwap_value_short = vwap_value

// Entry Criteria
confirm_up_trend = direction > 0 and macd > signal
confirm_down_trend = direction < 0 and macd < signal

// VWAP Confirmation
price_above_vwap = close > vwap_value_long
price_below_vwap = close < vwap_value_short

// Stop Loss and Take Profit
stop_loss_range = input(2, title="Stop Loss Range")
trail_offset = input(0.5, title="Trailing Stop Offset")

stop_loss_long = close - stop_loss_range
stop_loss_short = close + stop_loss_range

// Strategy Entry
if not (vwap_hideonDWM and timeframe.isdwm)
    if confirm_up_trend and price_above_vwap
        strategy.entry("Buy", strategy.long)
    if confirm_down_trend and price_below_vwap
        strategy.entry("Sell", strategy.short)

// Strategy Exit
if macd < signal and macd[1] >= signal[1]
    strategy.close("Buy", comment="MACD Crossover")

if macd > signal and macd[1] <= signal[1]
    strategy.close("Sell", comment="MACD Crossover")

// Plot Supertrend and VWAP
plot(supertrend, color=direction > 0 ? color.green : color.red, title="Supertrend")
plot(vwap_value_long, color=color.blue, title="VWAP Long")
plot(vwap_value_short, color=color.orange, title="VWAP Short")

// Plot MACD Histogram
hist = macd - signal
hist_color = hist >= 0 ? color.green : color.red
plot(hist, style=plot.style_histogram, color=hist_color, title="MACD Histogram")