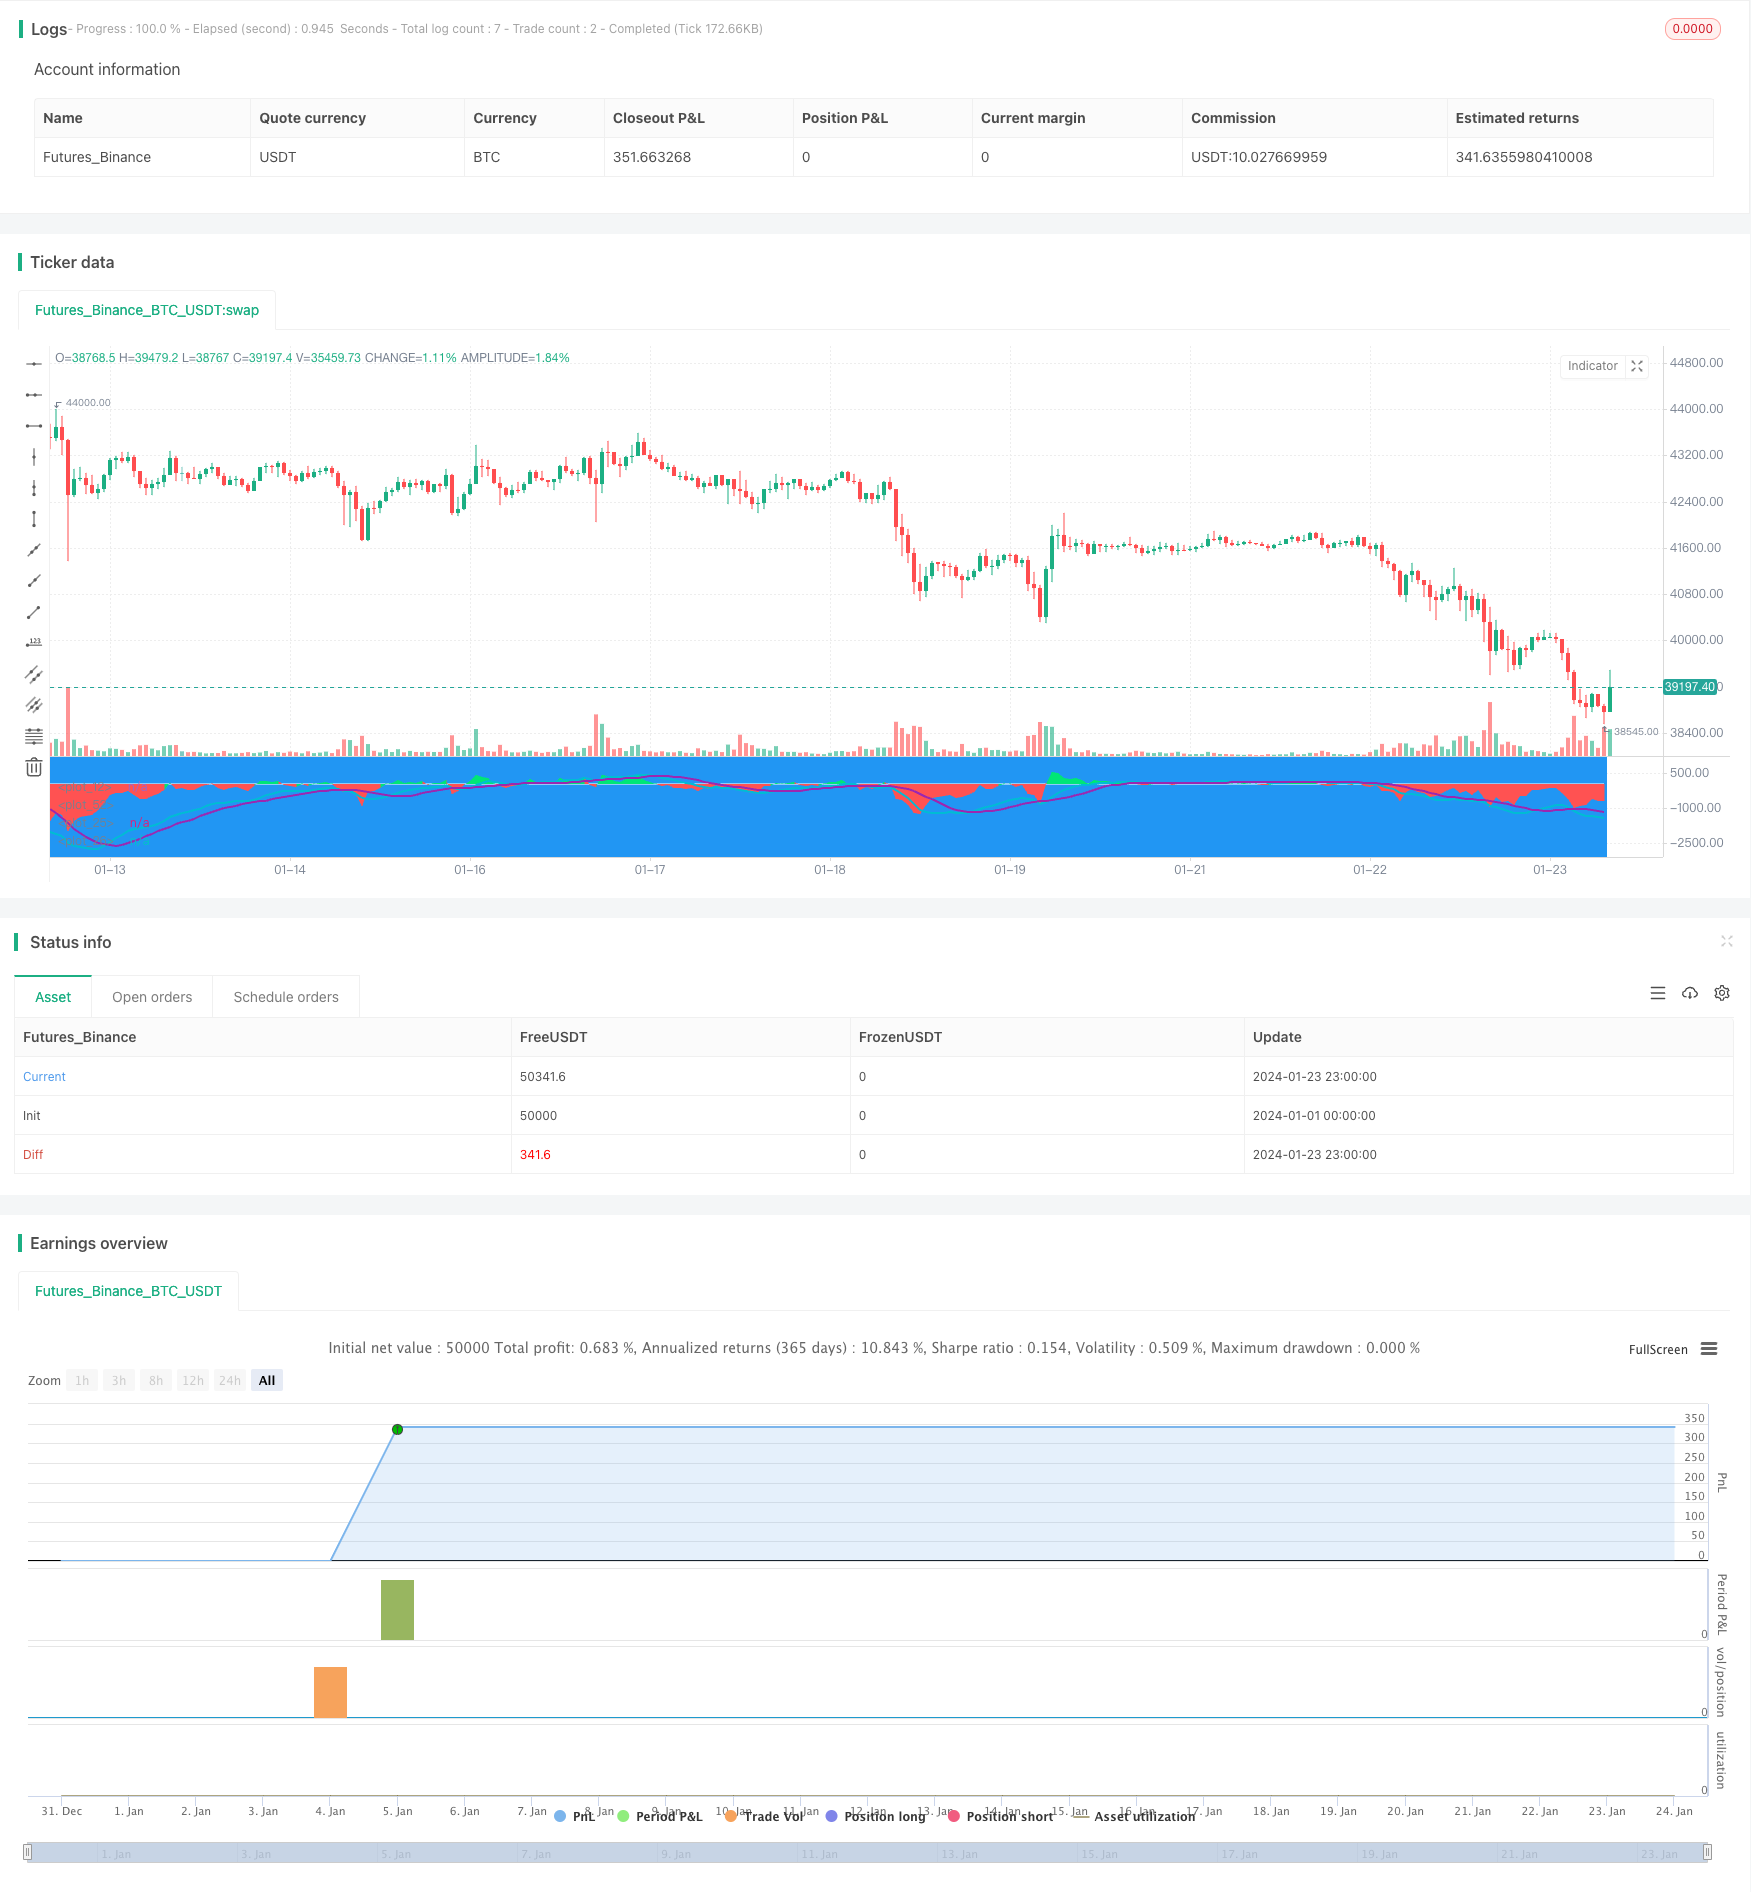
概述
本策略是一种基于EMA均线差值和MACD指标的复合策略,用于BTC的短线交易。它结合了EMA均线和MACD的信号,在特定条件下产生买入和卖出信号。
策略原理
当差值为负,且小于阈值,并且MACD出现空头交叉时,产生买入信号。当差值为正,且大于阈值,并且MACD出现多头交叉时,产生卖出信号。
通过组合使用EMA均线差值和MACD指标的信号,可以过滤掉一些假信号,提高信号的可靠性。
优势分析
- 使用了复合指标,信号更可靠
- 采用短周期参数设定,适合短线交易
- 有止损和止盈设置,可以控制风险
风险分析
- 市场剧烈波动时,止损可能被突破
- 需优化参数,使其更符合不同市场环境
- 需测试不同币种和不同交易所的效果
优化方向
- 优化EMA和MACD的参数,使其更符合BTC的波动环境
- 增加开仓仓位和加减仓策略,优化资金利用效率
- 增加止损方式,如移动止损、振荡止损等,降低风险
- 测试不同交易所和不同币种的效果
总结
本策略整合了均线和MACD两个指标的优点,使用了复合信号,可以有效过滤虚假信号。通过优化参数和开仓策略,可以得到稳定的收益。但是也需要警惕止损被突破的风险,需要进一步测试和完善。
策略源码
/*backtest
start: 2024-01-01 00:00:00
end: 2024-01-24 00:00:00
period: 1h
basePeriod: 15m
exchanges: [{"eid":"Futures_Binance","currency":"BTC_USDT"}]
*/

//@version=3
strategy("EMA50Diff & MACD Strategy", overlay=false)
EMA = input(18, step=1)
MACDfast = input(12)
MACDslow = input(26)
EMADiffThreshold = input(8)
MACDThreshold = input(80)
TargetValidityThreshold = input(65, step=5)
Target = input(120, step=5)
StopLoss = input(650, step=5)
ema = ema(close, EMA)
hl = plot(0, color=white, linewidth=1)
diff = close - ema
clr = color(blue, transp=100)
if diff>0
    clr := lime
else
    if diff<0
        clr := red

fastMA = ema(close, MACDfast)
slowMA = ema(close, MACDslow)
macd = (fastMA - slowMA)*3
signal = sma(macd, 9)
plot(macd, color=aqua, linewidth=2)
plot(signal, color=purple, linewidth=2)

macdlong = macd<-MACDThreshold and signal<-MACDThreshold and crossover(macd, signal)
macdshort = macd>MACDThreshold and signal>MACDThreshold and crossunder(macd, signal)
position = 0.0
position := nz(strategy.position_size, 0.0)
long = (position < 0 and close < strategy.position_avg_price - TargetValidityThreshold and macdlong) or
     (position == 0.0 and diff < -EMADiffThreshold and diff > diff[1] and diff[1] < diff[2] and macdlong)

short = (position > 0 and close > strategy.position_avg_price + TargetValidityThreshold and macdshort) or
      (position == 0.0 and diff > EMADiffThreshold and diff < diff[1] and diff[1] > diff[2] and macdshort)
amount = (strategy.equity / close) //- ((strategy.equity / close / 10)%10)
bgclr = color(blue, transp=100) //#0c0c0c
if long
    strategy.entry("long", strategy.long, amount)
    bgclr := green
if short
    strategy.entry("short", strategy.short, amount)
    bgclr := maroon
bgcolor(bgclr, transp=20)
strategy.close("long", when=close>strategy.position_avg_price + Target)
strategy.close("short", when=close<strategy.position_avg_price - Target)
strategy.exit("STOPLOSS", "long", stop=strategy.position_avg_price - StopLoss)
strategy.exit("STOPLOSS", "short", stop=strategy.position_avg_price + StopLoss)
//plotshape(long, style=shape.labelup, location=location.bottom, color=green)
//plotshape(short, style=shape.labeldown, location=location.top, color=red)
pl = plot(diff, style=histogram, color=clr)
fill(hl, pl, color=clr)