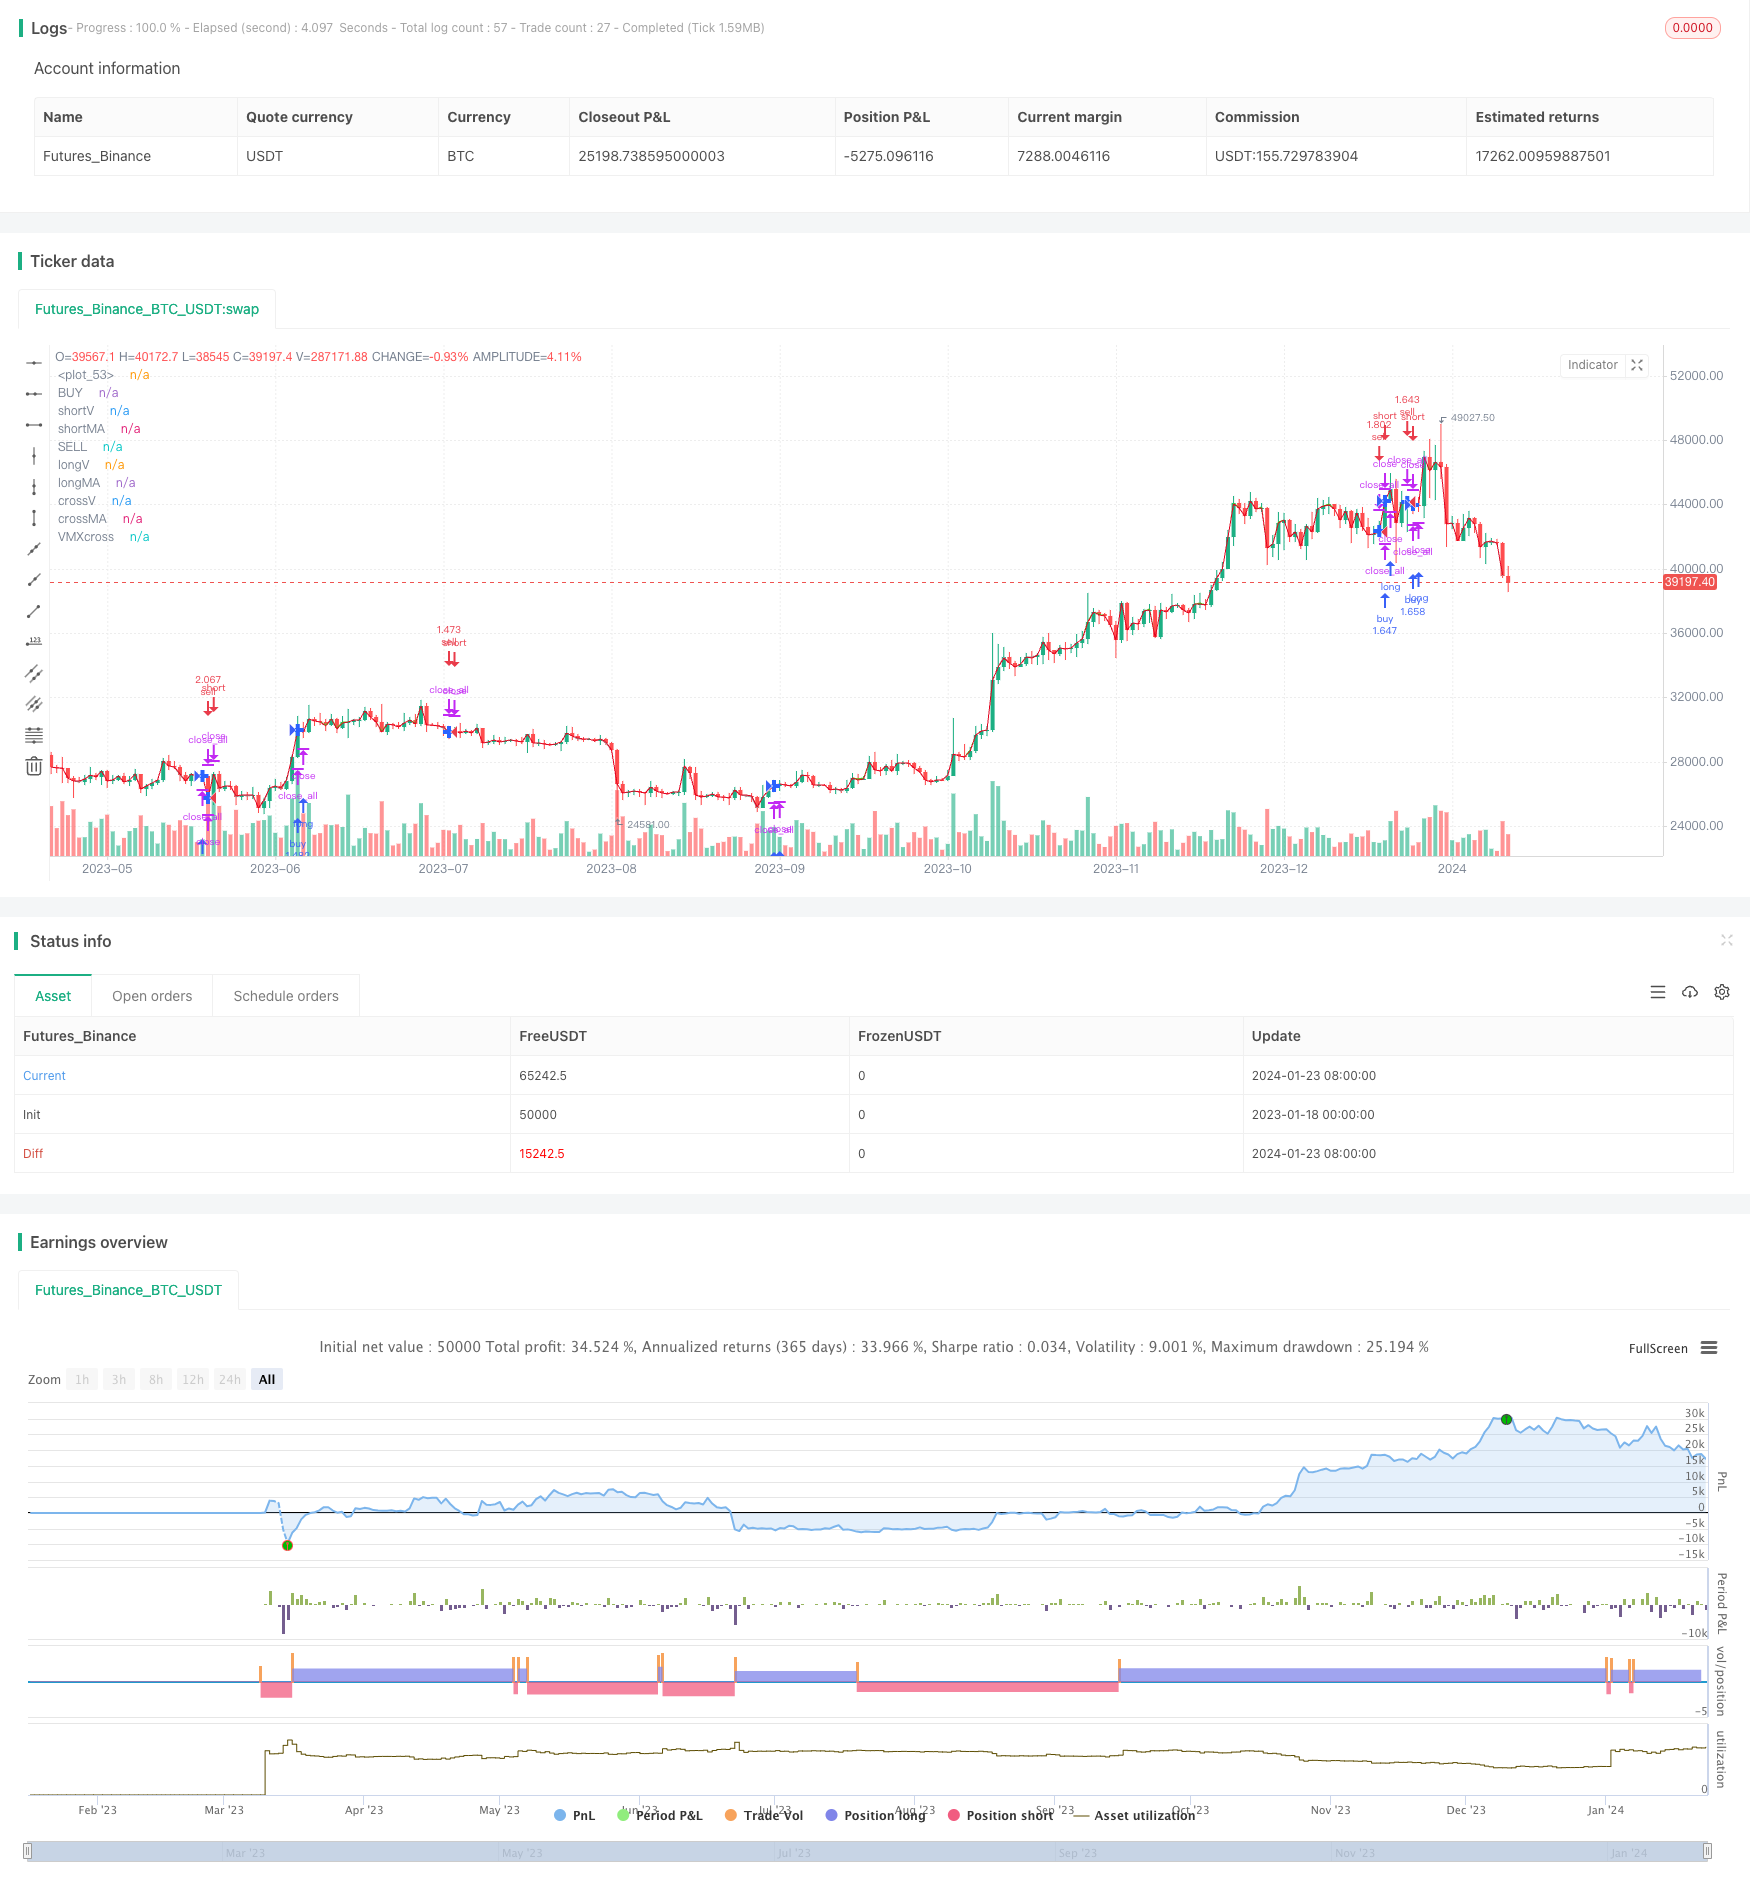
概述
本策略名称为“双指数平均线交叉量化交易策略”。该策略通过计算双指数移动平均线(Exponential Moving Average, EMA)并进行交叉买卖点判断,结合量化交易开仓原理,实现自动化交易。
策略原理
本策略核心逻辑基于双指数移动平均线。指标1为短期20日EMA,指标2为长期50日EMA。当短期EMA从下方上穿长期EMA时产生买入信号;当短期EMA从上方下穿长期EMA时产生卖出信号。这样利用EMA不同参数的交叉来判断市场买卖点。
此外,策略还使用Vortex量化指标来辅助判断趋势和产生交易信号。Vortex指标通过计算最高价与昨日收盘价、最低价与昨日收盘价的差值比较判断涨跌力道,参数周期为1日和3日。结合Vortex指标可过滤掉部分非主要趋势的EMA信号。
在交易信号产生时,根据策略内置的资金管理模块,结合盈亏比例原理进行风险管理。策略允许设置止损位和止盈位来锁定盈利,以控制风险。
优势分析
- 1. 策略整合双EMA交叉和Vortex量化指标,充分利用指标优势,提高信号准确性
- 2. 自动化交易系统,无需人工参与,降低人为失误概率
- 3. 内置自动止损止盈功能,可以限制单笔交易最大Loss
- 4. 资金管理模块控制每个交易的投入资金比例,从而控制总体交易风险
风险分析
- 1. EMA交叉信号可能出现假信号,Vortex量化指标也无法完全过滤假信号,所以会存在一定亏损概率
- 2. 突发重大黑天鹅事件可能直接扩大单笔交易亏损
- 3. 回撤控制依赖止损功能,如果突破止损会造成更大损失
优化方向: - 1. 可以测试调整EMA参数,优化交叉信号 - 2. 可以结合更多指标过滤信号 - 3. 可以通过机器学习算法自动优化参数
总结
本策略总体而言是一个典型的双EMA交叉策略,利用EMA不同参数之间的交叉来判断市场买卖时机,属于中短线交易策略。策略最大的优势在于利用量化指标进行信号过滤,并通过自动化交易系统实现无人值守,同时内置止损止盈来控制风险,表现相对稳定。后期可通过参数优化以及引入更多辅助指标来进一步提高策略效果。
策略源码
/*backtest
start: 2023-01-18 00:00:00
end: 2024-01-24 00:00:00
period: 1d
basePeriod: 1h
exchanges: [{"eid":"Futures_Binance","currency":"BTC_USDT"}]
*/

// This source code is subject to the terms of the Mozilla Public License 2.0 at https://mozilla.org/MPL/2.0/
// © smottybugger

//@version= 5
strategy("The  Averages Moving_X_Vortex", shorttitle="2.5billion BTC lol" , calc_on_order_fills=true, calc_on_every_tick=true, commission_type=strategy.commission.percent, commission_value=0.02, default_qty_type=strategy.percent_of_equity, default_qty_value=100, initial_capital=100, margin_long=0, margin_short=0,overlay=true)
// Dual Vortex
period_1 = input(15, "short Time")
period_2 = input(25, "long time")
VMP = math.sum(math.abs(high - low[3]), period_1)
VMM = math.sum(math.abs(low - high[1]), period_2)
STR = math.sum(ta.atr(1), period_1)
STR2 = math.sum(ta.atr(1), period_2)
VXpower= (input(5,"Vortex Power")/10000)*close
shorterV =(VMP / STR)*VXpower
longerV = (VMM / STR2)*VXpower

// MACross
shortlen = input(20, "ShortMa")
longlen = input(29, "LongMA")
shorterMA = ta.sma(close, shortlen)
longerMA = ta.sma(close, longlen)

// Vortex "MACross Stabilized"
Varance = input(1, "Vortex Stabilize")
Vpercent = (Varance / 100)
shortV= ((((shorterMA-close)* Vpercent)+shorterV)/2)+close
longV = ((((longerMA -close )*Vpercent)+longerV)/2)+close

//MAcross vortex stabilized
Marance = input(1, "MACross Stabilize")
MApercent = Marance / 100
shortMA = ((((shorterMA-close)*MApercent)+shorterV)/2)+close
longMA = ((((longerMA-close)*MApercent)+longerV)/2)+close

//VMXadveraged Moving cross adveraged
VMXL=(longV+longMA)/2
VMXS=(shortV+shortMA)/2
VXcross= ta.cross(VMXS,VMXL) ? VMXS : na
VMXcross= ta.cross(VMXS,VMXL)

//plot
plot(VMXS,"BUY",color=#42D420)
plot(VMXL,"SELL",color=#e20420)
crossV= ta.cross(shortV, longV) ? shortV : na
plot(shortV ,"shortV", color=#42D420)
plot(longV,"longV", color=#e20420)
plot(crossV,"crossV", color=#2962FF, style=plot.style_cross, linewidth=4)
crossMA = ta.cross(shortMA, longMA) ? shortMA : na
plot(shortMA,"shortMA", color=#42D420)
plot(longMA,"longMA", color=#e20420)
plot(crossMA,"crossMA", color=#2962FF, style=plot.style_cross, linewidth=4)
plot(VXcross,"VMXcross",color=#2962FF, style= plot.style_cross,linewidth=4)
plot(close,color=#999999)

// Vortex Condistyle
is_Vlong =shortV< longV
is_Vshort =shortV>longV


// Vortex commands
Vlong =  ta.crossunder(longV, shortV)
Vshort =ta.crossover(shortV,longV)
VorteX = ta.cross(longV, shortV)

// MACross Conditions
is_MAlong = shortMA < longV
is_MAshort = shortMA > shortV


//VMX Conditions
is_VMXlong=VMXS<VMXL
is_VMXshort=VMXS>VMXL

// MA commands
MAlong = ta.crossunder(shortMA, longV)
MAshort =ta.crossover(shortMA, shortV)
MAcross =  ta.cross(shortMA, longMA)

//VMX COMMANss
VMXBUY=ta.crossover( VMXS,VMXL)
VMXSELL=ta.crossunder(VMXS,VMXL)

// Close Crossing PositionLMXs

CS=is_MAshort or is_VMXshort
CL= is_MAlong or is_VMXlong
OS=MAshort or VMXSELL
OL=MAlong or VMXBUY


if VMXcross
    strategy.close_all ("closed")

//if CS and  OL
    strategy.close("Short",comment="Short Closed")


//if CL and  OS
    strategy.close("Long",comment="Long Closed" )

//CA1= is_MAcross and is_VorteX
//if CA1
   // strategy.close_all(comment="X2X")

// Defalongyntry qty

if is_VMXlong and VMXSELL
    strategy.entry("sell",strategy.short)


if is_VMXshort and VMXBUY
    strategy.entry("buy",strategy.long)


// Stop Losses & Taking Profit
sllp = input(0, "Stop Loss Long")
sll = (1 - sllp / 100) * strategy.position_avg_price
is_sll = input(true, "Stop Long")

tplp = input(0, "Take Profit Long")
tpl = (1 + tplp / 100) * strategy.position_avg_price
is_tpl = input(true, "Take Long")

slsp = input(0, "Stop Loss Short")
sls = (1 + slsp / 100) * strategy.position_avg_price
is_sls = input(true, "Stop Short")

tpsp = input(0, "Take Profit Short")
tps = (1 - tpsp / 100) * strategy.position_avg_price
is_tps = input(true, "Take Short")

if (is_sll or is_sls)
    strategy.close("Stop Losses", qty_percent=100)

if (is_tpl or is_tps)
    strategy.close("Take Profits", qty_percent=100)


 //Strategy Backtest
//plot(strategy.equity, "Equity", color=color.red, linewidth=2, style=plot.style_areabr)