概述
该策略基于广谱移动平均线,通过快慢移动平均线的金叉死叉形成交易信号。广谱移动平均线覆盖从简单移动平均线到震荡移动平均线等多种类型,可以通过参数调整自由组合,具有较强的适应性。
策略原理
该策略使用变体移动平均线函数,可以生成12种不同类型的移动平均线。基本原理是计算快线(Close MA)和慢线(Open MA)两条移动平均线,当快线上穿慢线时生成买入信号,快线下穿慢线时生成卖出信号。同时设置止损止盈参数,可以实现自动止损止盈。
关键逻辑是通过variant函数生成两条移动平均线:closeSeries = variant(basisType, close, basisLen, offsetSigma, offsetALMA)和openSeries = variant(basisType, open, basisLen, offsetSigma, offsetALMA)。variant函数封装了12种不同类型的平均线计算方法,通过basisType参数可以自由选择。这样就实现了广谱移动平均线的组合。
基本交易信号生成逻辑是:longCond = xlong 和 shortCond = xshort,也就是快线上穿慢线就做多,快线下穿慢线就做空。
策略入场规则是当longCond或shortCond条件满足时分别做多做空。止损止盈规则是当价格移动达到预设的止损止盈点数时止损或止盈。
优势分析
该策略最大的优势在于可以自由组合多种不同类型的移动平均线。不同市场不同周期,哪种移动平均线最适合是不定的,该策略提供了强大的自定义能力。用户可以通过反复测试确定最佳参数组合,从而针对特定市场制定最优方案。
另一个优势是策略逻辑简单清晰,但是却提供了强大的功能。用户很容易理解和使用该策略。同时,丰富的输入参数也为高级用户提供了充分的优化空间。
风险分析
该策略最大的风险在于广谱移动平均线本身就存在一定程度的滞后。当出现异常价格突破时,可能造成较大的亏损。此外,如果参数选择不当,也可能导致交易频率过高或产生多余信号。
为降低风险,建议结合其他指标判断信号的有效性,避免出现假突破。此外,参数优化和回测也十分必要,需要反复测试找到最佳参数组合。在实盘中应适当缩减仓位规模,控制单笔亏损。
优化方向
该策略有以下几个主要的优化方向:
- 测试更多类型的移动平均线组合,寻找最佳组合
- 增加过滤器,避免假信号,例如结合交易量指标等
- 优化移动平均线的长度参数,寻找最佳参数
- 优化仓位规模和止损止盈参数
- 尝试不同的品种和周期
通过上述几个方向的优化,可以持续提升策略的实盘表现。
总结
该交易策略基于广谱移动平均线实现了高度灵活性。它提供了强大的自定义功能,用户可以自由选择和组合不同类型的平均线。策略逻辑简单清晰,使用方便,同时也提供了丰富的优化空间。通过参数优化和风险控制,该策略可以适应不同市场环境,并获得稳定收益。它是一种高效灵活的趋势跟踪策略。
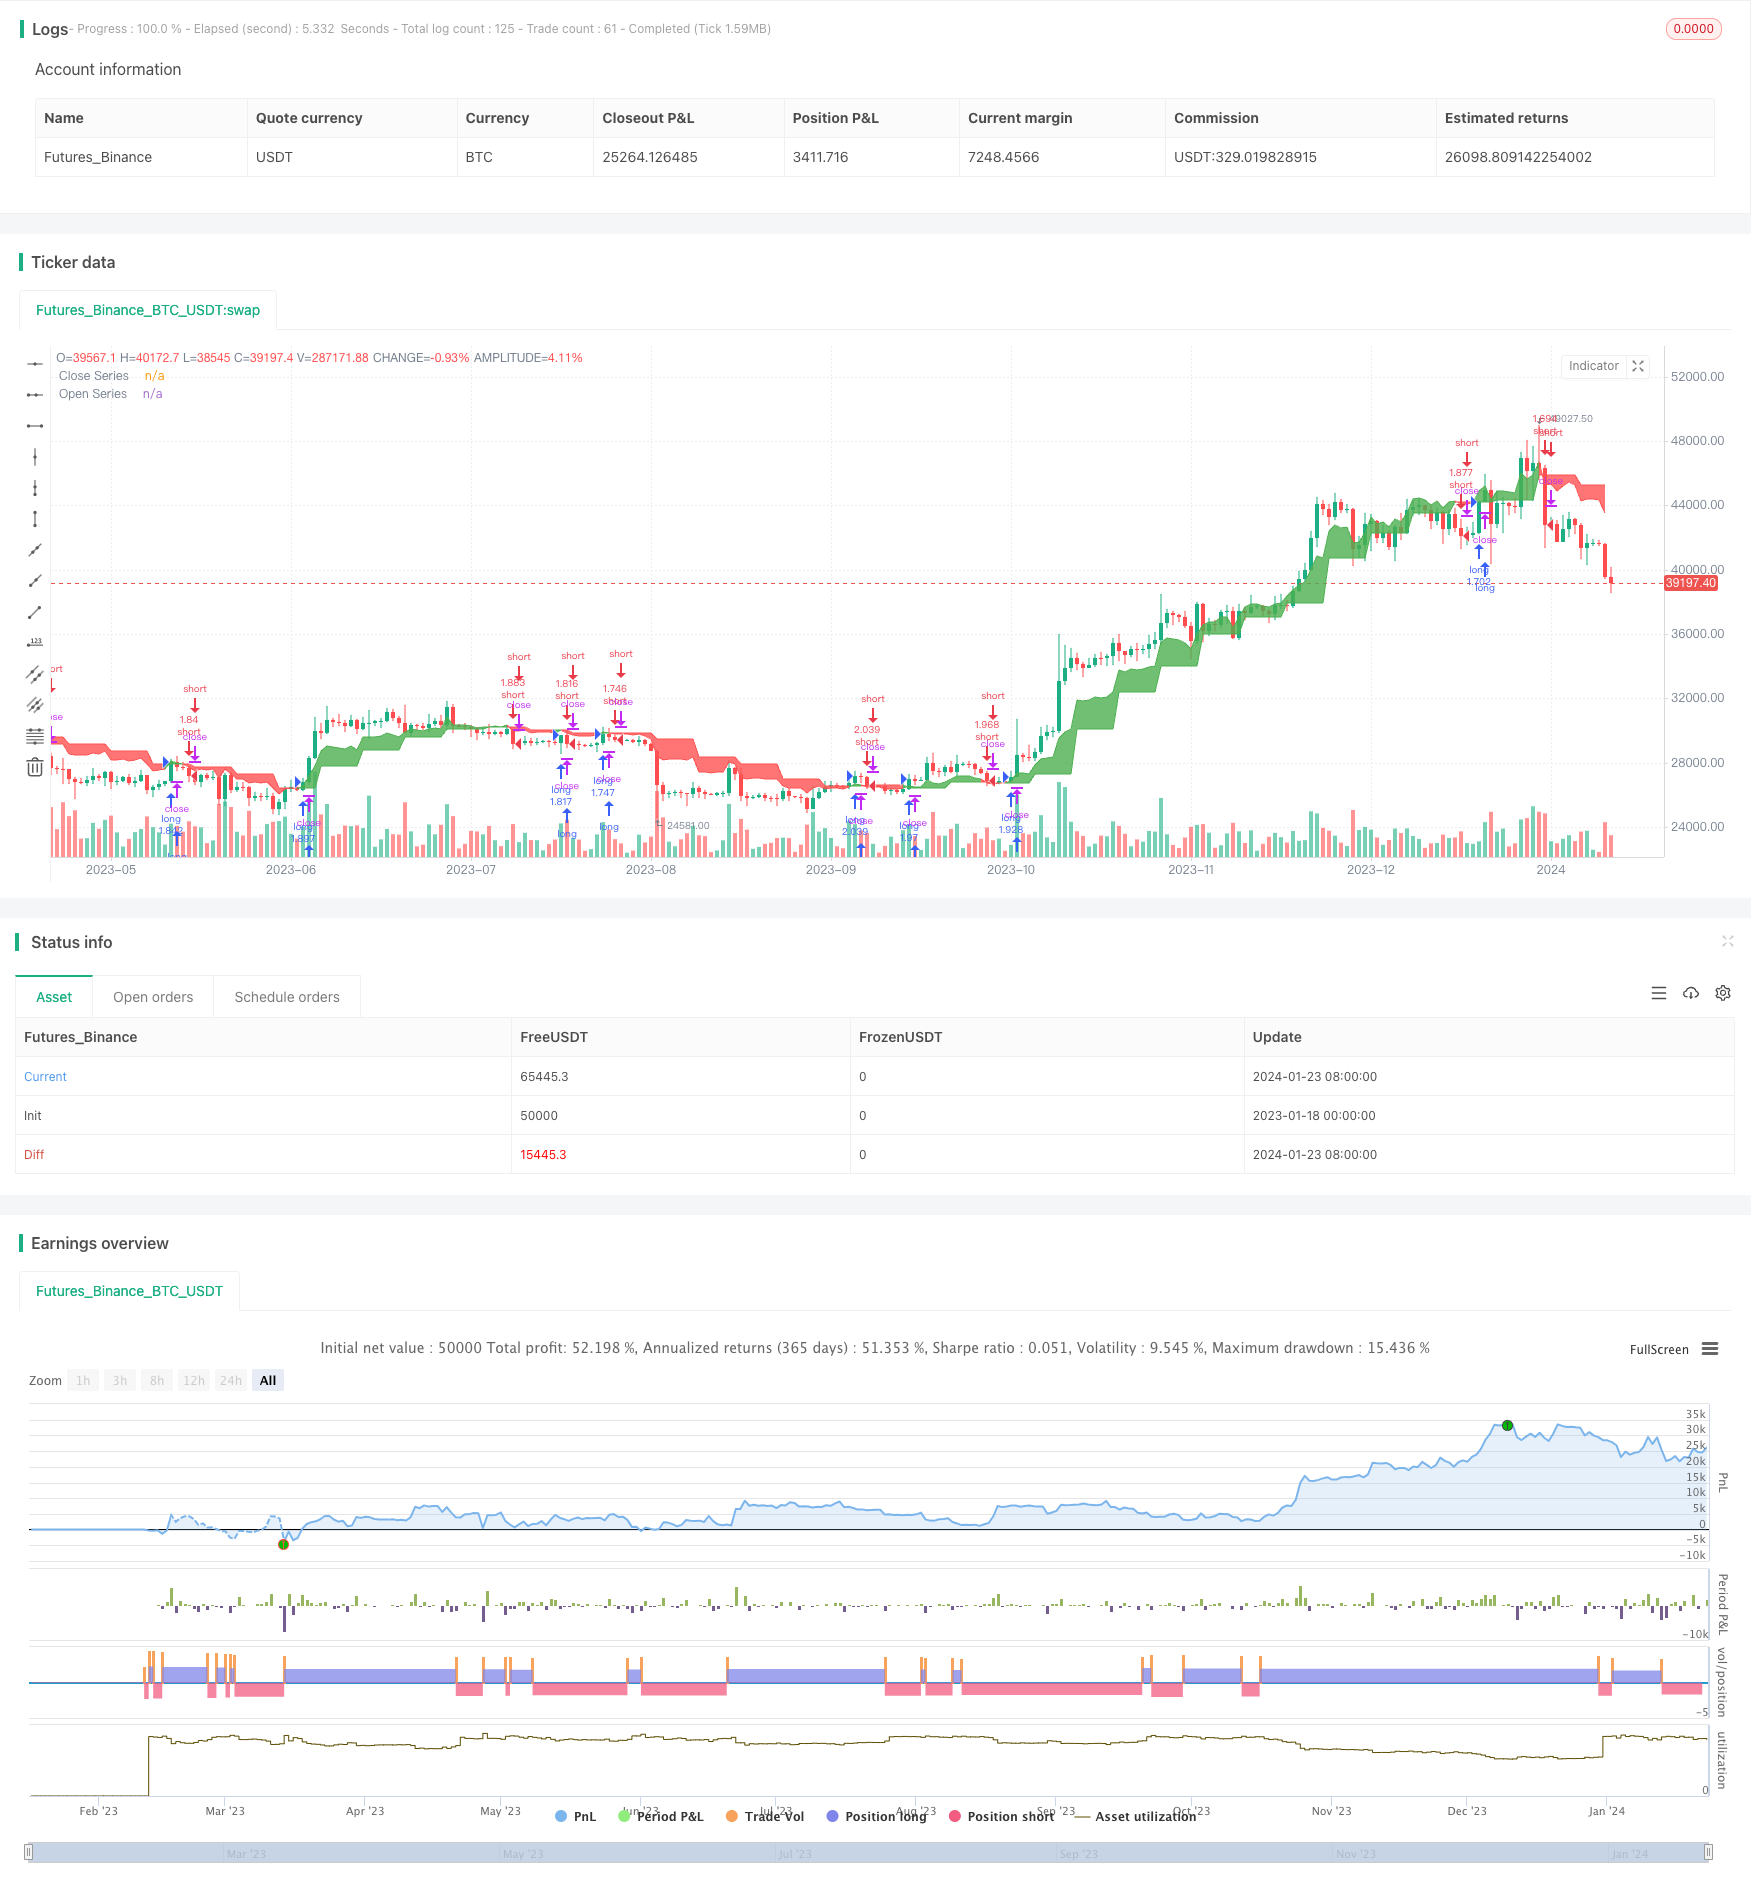
/*backtest
start: 2023-01-18 00:00:00
end: 2024-01-24 00:00:00
period: 1d
basePeriod: 1h
exchanges: [{"eid":"Futures_Binance","currency":"BTC_USDT"}]
*/

//@version=4
//

strategy(title="Long/Short", shorttitle="Banana Maker", overlay=true, pyramiding=0, default_qty_type=strategy.percent_of_equity, default_qty_value=100, calc_on_every_tick=false)


// === INPUTS ===
useRes = input(defval=true, title="Use Alternate Resolution?")
intRes = input(defval=7, title="Multiplier for Alernate Resolution")
stratRes = timeframe.ismonthly ? tostring(timeframe.multiplier * intRes, "###M") :
   timeframe.isweekly ? tostring(timeframe.multiplier * intRes, "###W") :
   timeframe.isdaily ? tostring(timeframe.multiplier * intRes, "###D") :
   timeframe.isintraday ? tostring(timeframe.multiplier * intRes, "####") : '60'
basisType = input(defval="DEMA", title="MA Type: ", options=["SMA", "EMA", "DEMA", "TEMA", "WMA", "VWMA", "SMMA", "HullMA", "LSMA", "ALMA", "SSMA", "TMA"])
basisLen = input(defval=8, title="MA Period", minval=1)
offsetSigma = input(defval=6, title="Offset for LSMA / Sigma for ALMA", minval=0)
offsetALMA = input(defval=0.85, title="Offset for ALMA", minval=0, step=0.01)
scolor = input(false, title="Show coloured Bars to indicate Trend?")
delayOffset = input(defval=0, title="Delay Open/Close MA (Forces Non-Repainting)", minval=0, step=1)
tradeType = input("BOTH", title="What trades should be taken : ", options=["LONG", "SHORT", "BOTH", "NONE"])
// === /INPUTS ===

// Constants colours that include fully non-transparent option.
green100 = #008000FF
lime100 = #6ad279
red100 = #FF0000FF
blue100 = #0000FFFF
aqua100 = #00FFFFFF
darkred100 = #8B0000FF
gray100 = #808080FF

// === BASE FUNCTIONS ===
variant(type, src, len, offSig, offALMA) =>
    v1 = sma(src, len)  // Simple
    v2 = ema(src, len)  // Exponential
    v3 = 2 * v2 - ema(v2, len)  // Double Exponential
    v4 = 3 * (v2 - ema(v2, len)) + ema(ema(v2, len), len)  // Triple Exponential
    v5 = wma(src, len)  // Weighted
    v6 = vwma(src, len)  // Volume Weighted
    v7 = 0.0
    sma_1 = sma(src, len)  // Smoothed
    v7 := na(v7[1]) ? sma_1 : (v7[1] * (len - 1) + src) / len
    v8 = wma(2 * wma(src, len / 2) - wma(src, len), round(sqrt(len)))  // Hull
    v9 = linreg(src, len, offSig)  // Least Squares
    v10 = alma(src, len, offALMA, offSig)  // Arnaud Legoux
    v11 = sma(v1, len)  // Triangular (extreme smooth)
    // SuperSmoother filter
    // © 2013  John F. Ehlers
    a1 = exp(-1.414 * 3.14159 / len)
    b1 = 2 * a1 * cos(1.414 * 3.14159 / len)
    c2 = b1
    c3 = -a1 * a1
    c1 = 1 - c2 - c3
    v12 = 0.0
    v12 := c1 * (src + nz(src[1])) / 2 + c2 * nz(v12[1]) + c3 * nz(v12[2])
    type == "EMA" ? v2 : type == "DEMA" ? v3 :
       type == "TEMA" ? v4 : type == "WMA" ? v5 : type == "VWMA" ? v6 :
       type == "SMMA" ? v7 : type == "HullMA" ? v8 : type == "LSMA" ? v9 :
       type == "ALMA" ? v10 : type == "TMA" ? v11 : type == "SSMA" ? v12 : v1

// security wrapper for repeat calls* NEEDS REFINEMENT- backtesting this shows repaint. need new wrapper
reso(exp, use, res) =>
    security_1 = security(syminfo.tickerid, res, exp, gaps=barmerge.gaps_off, lookahead=barmerge.lookahead_on)
    use ? security_1 : exp


// === /BASE FUNCTIONS ===

// === SERIES SETUP ===
closeSeries = variant(basisType, close[delayOffset], basisLen, offsetSigma, offsetALMA)
openSeries = variant(basisType, open[delayOffset], basisLen, offsetSigma, offsetALMA)
// === /SERIES ===

// === PLOTTING ===

// alt resulution
closeSeriesAlt = reso(closeSeries, useRes, stratRes)
openSeriesAlt = reso(openSeries, useRes, stratRes)
//
trendColour = closeSeriesAlt > openSeriesAlt ? color.green : color.red
bcolour = closeSeries > openSeriesAlt ? lime100 : red100
barcolor(scolor ? bcolour : na, title="Bar Colours")
closeP = plot(closeSeriesAlt, title="Close Series", color=trendColour, linewidth=0, style=plot.style_line, transp=1)
openP = plot(openSeriesAlt, title="Open Series", color=trendColour, linewidth=0, style=plot.style_line, transp=1)
fill(closeP, openP, color=trendColour, transp=80)

// === /PLOTTING ===
//

//
// === ALERT conditions

xlong = crossover(closeSeriesAlt, openSeriesAlt)
xshort = crossunder(closeSeriesAlt, openSeriesAlt)
longCond = xlong  // alternative: longCond[1]? false : (xlong or xlong[1]) and close>closeSeriesAlt and close>=open
shortCond = xshort  // alternative: shortCond[1]? false : (xshort or xshort[1]) and close<closeSeriesAlt and close<=open


// === /ALERT conditions. needs work in study mode. the banana maker is the study script.
// Create alert for cross, shunt back 1 if source is not 'open', this should prevent repaint issue.
//shunt = RSIsrc == open ? 0 : 1
//shunt = 0
//c_alert = (buy[shunt]==1 or sell[shunt]==1)
//alertcondition(c_alert, title="QQECROSS Alert", message="QQECROSS Alert")
// show only when alert condition is met and bar closed.
//plotshape(c_alert,title= "Alert Indicator Closed", location=location.bottom, color=sell[shunt]==1?red:green, transp=0, style=shape.circle)

//Repaint city, study mode will help but wont trigger the alerts


// === STRATEGY ===
// stop loss
slPoints = input(defval=0, title="Initial Stop Loss Points (zero to disable)", minval=0)
tpPoints = input(defval=0, title="Initial Target Profit Points (zero for disable)", minval=0)
// Include bar limiting algorithm
ebar = input(defval=1000, title="Number of Bars for Back Testing", minval=0)
dummy = input(false, title="- SET to ZERO for Daily or Longer Timeframes")
//
// Calculate how many mars since last bar
tdays = (timenow - time) / 60000.0  // number of minutes since last bar
tdays := timeframe.ismonthly ? tdays / 1440.0 / 5.0 / 4.3 / timeframe.multiplier :
   timeframe.isweekly ? tdays / 1440.0 / 5.0 / timeframe.multiplier :
   timeframe.isdaily ? tdays / 1440.0 / timeframe.multiplier :
   tdays / timeframe.multiplier  // number of bars since last bar
//
//set up exit parameters
TP = tpPoints > 0 ? tpPoints : na
SL = slPoints > 0 ? slPoints : na

// Make sure we are within the bar range, Set up entries and exit conditions
if (ebar == 0 or tdays <= ebar) and tradeType != "NONE"
    strategy.entry("long", strategy.long, when=longCond == true and tradeType != "SHORT")
    strategy.entry("short", strategy.short, when=shortCond == true and tradeType != "LONG")
    strategy.close("long", when=shortCond == true and tradeType == "LONG")
    strategy.close("short", when=longCond == true and tradeType == "SHORT")
    strategy.exit("XL", from_entry="long", profit=TP, loss=SL)
    strategy.exit("XS", from_entry="short", profit=TP, loss=SL)


// === /STRATEGY ===
// eof