概述
该策略是基于Fisher变换指标的回测策略。Fisher变换公式可以将价格数据转换成正态分布,用来识别价格极值点和转折点。该策略结合Fisher变换指标判断价格趋势,实现automated trading。
策略原理
- 计算HL2指标
- 计算最近Length周期内HL2的最大值xMaxH和最小值xMinL
- 计算Fisher变换指标:
- nValue1为0.33×(HL2标准化)+0.67×nValue1的前一周期值
- nValue2限制nValue1在-0.99到0.99之间
- nFish为nValue2的对数函数转化
- 判断nFish为正还是负,确定仓位方向
- 仓位信号possig,如果设置反向交易,则仓位取反
- 入场:possig=1做多,possig=-1做空
策略优势分析
- Fisher变换指标能识别价格极值点和转折点,判断趋势准确
- 结合HL2指标过滤震荡,提高胜率
- 可设置反向交易,适应不同市场环境
- 自动化交易,无需人工判断,降低交易成本
风险分析
- Fisher变换指标有滞后,可能错过短线价格变化
- 震荡趋势中止损风险大
- 反向交易设置不当可能导致系统性失误交易
- 未考虑跨时间周期验证,存在一定的假阳性风险
风险解决:
- 适当调整参数,缩短延迟
- 加大止损幅度,控制单笔损失
- 优化反向交易结合其他指标过滤
- 增加趋势、价格等级、波段等多重验证
策略优化方向
- 结合趋势指标过滤,确保大趋势一致
- 增加波段指标,提高价格转折判断准确性
- 多时间周期验证,避免假阳性
- 动态调整止损幅度
- 优化参数,最大化胜率和盈利因子
以上优化策略可以进一步提高策略胜率、锁定盈利、控制风险,从而获得更稳定、高效的交易结果。
总结
Fisher变换指标回测策略整合Fisher变换指标判断价格转折点和趋势方向。该策略判断准确,自动化程度高,通过参数优化可以获得稳定而高效的交易结果。但也存在一定滞后、假阳性等风险,需要引入多重验证机制和动态调整方式进一步优化,使策略更具弹性和鲁棒性。
策略源码
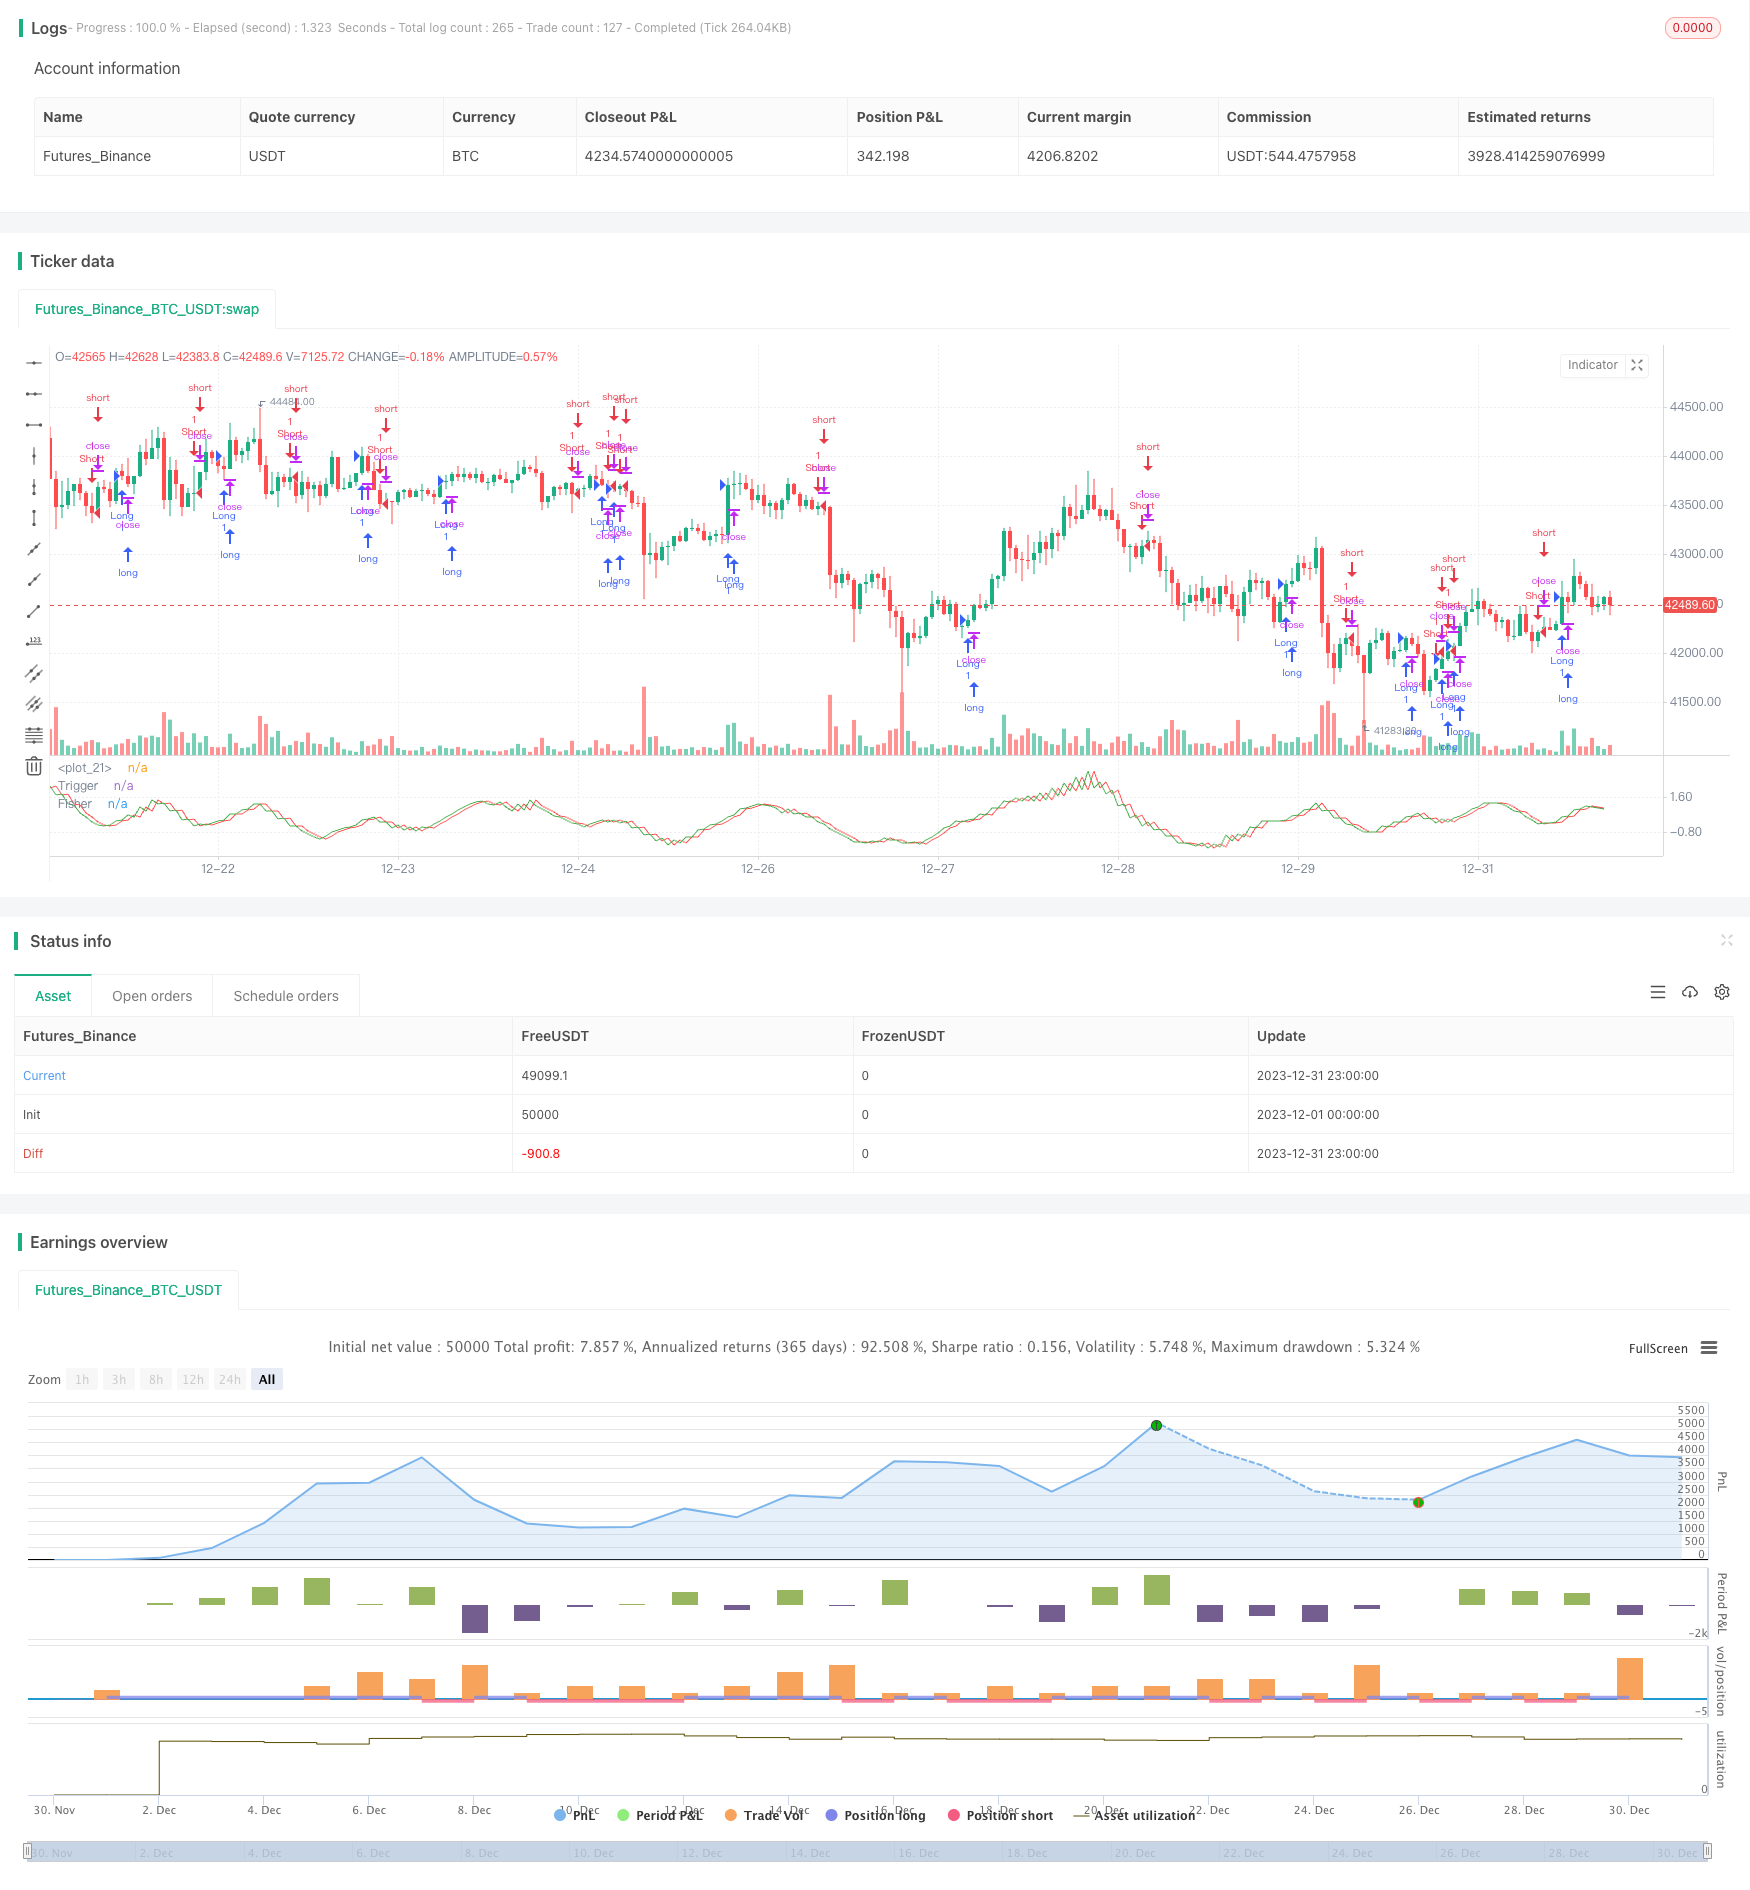
/*backtest
start: 2023-12-01 00:00:00
end: 2023-12-31 23:59:59
period: 1h
basePeriod: 15m
exchanges: [{"eid":"Futures_Binance","currency":"BTC_USDT"}]
*/

//@version = 2
////////////////////////////////////////////////////////////
//  Copyright by HPotter v2.0 22/12/2016
// 	Market prices do not have a Gaussian probability density function
// 	as many traders think. Their probability curve is not bell-shaped.
// 	But trader can create a nearly Gaussian PDF for prices by normalizing
// 	them or creating a normalized indicator such as the relative strength
// 	index and applying the Fisher transform. Such a transformed output
// 	creates the peak swings as relatively rare events.
// 	Fisher transform formula is: y = 0.5 * ln ((1+x)/(1-x))
// 	The sharp turning points of these peak swings clearly and unambiguously
// 	identify price reversals in a timely manner.
//
//  For signal used zero.
// You can change long to short in the Input Settings
// Please, use it only for learning or paper trading. Do not for real trading.
////////////////////////////////////////////////////////////
strategy(title="Fisher Transform Indicator by Ehlers Backtest", shorttitle="Fisher Transform Indicator by Ehlers")
Length = input(10, minval=1)
reverse = input(false, title="Trade reverse")
hline(1, color=white)
xHL2 = hl2
xMaxH = highest(xHL2, Length)
xMinL = lowest(xHL2,Length)
nValue1 = 0.33 * 2 * ((xHL2 - xMinL) / (xMaxH - xMinL) - 0.5) + 0.67 * nz(nValue1[1])
nValue2 =   iff(nValue1 > .99,  .999,
	         iff(nValue1 < -.99, -.999, nValue1))
nFish = 0.5 * log((1 + nValue2) / (1 - nValue2)) + 0.5 * nz(nFish[1])
pos = iff(nFish > 0, 1,
	   iff(nFish < 0, -1, nz(pos[1], 0)))
possig = iff(reverse and pos == 1, -1,
          iff(reverse and pos == -1, 1, pos))
if (possig == 1)
    strategy.entry("Long", strategy.long)
if (possig == -1)
    strategy.entry("Short", strategy.short)
// barcolor(possig == -1 ? red: possig == 1 ? green : blue )
plot(nFish, color=green, title="Fisher")
plot(nz(nFish[1]), color=red, title="Trigger")