概述
这是一个结合多种技术指标的跟踪止损交易策略。主要使用 Supertrend、Stochastic、200日移动平均线和ATR止损这些指标来识别交易信号和设置止损位。该策略适合中长线趋势交易,可以有效控制风险。
策略原理
当Stochastic K线从超买区下落、Supertrend指示趋势向上、价格突破200日移动平均线时,做多;当Stochastic K线从超卖区上涨、Supertrend指示趋势向下、价格跌破200日移动平均线时,做空。交易后使用ATR指标动态设置止损位。
具体来说,当Stochastic K值上穿80时,视为超买信号;当Stochastic K值下穿20时,视为超卖信号。Supertrend指标决定价格趋势方向,Supertrend指示向上时代表价格处于上涨趋势,Supertrend指示向下时代表价格处于下跌趋势。ATR指标用来计算真实波幅。
做多信号触发条件:Stochastic K线从超买区下落(小于80)、Supertrend指示向上、价格高于200日移动平均线。
做空信号触发条件:Stochastic K线从超卖区上涨(大于20)、Supertrend指示向下、价格低于200日移动平均线。
入场后,设置ATR止损来跟踪价格波动控制风险。多单止损为最低价减去ATR值乘以系数;空单止损为最高价加上ATR值乘以系数。
策略优势
这种策略结合多种指标判断趋势方向和入场时机,可以有效过滤假信号。同时,采用ATR动态跟踪止损,可以根据市场波动情况来控制风险,最大程度保存资金。
相比简单移动平均线等趋势跟踪策略,这种策略可以更好地捕捉转折点。相比单一止损方式,这种ATR动态止损可以更加灵活。所以,这种策略整体来说具有较好的风险收益比。
策略风险
该策略主要依赖指标判断,如果指标发出错误信号,则可能导致由于反向操作亏损。另外在震荡行情中,止损可能被频繁触发,带来损失。
此外,ATR止损虽然可以根据波动调整止损位,但无法完全避免止损被击穿的概率。如果遇到价格跳空,止损单可能会被直接触发。
策略优化
这种策略可以从以下几个维度进行优化:
调整指标参数,优化买卖信号的准确率。例如可以测试不同参数的Stochastic指标,或者调整Supertrend指标的ATR周期和乘数参数。
测试其他止损方式的效果。例如可以尝试比ATR止损更加灵活的自适应智能止损算法,或者考虑让止损跟随一个移动止损位。
增加过滤条件,在更加可靠的情况下入场。例如可以增加交易量能量指标等过滤器,避免在量能不足时依据指标错误入场。
优化资金管理策略,例如动态调整仓位。
总结
Stochastic Supertrend跟踪止损交易策略综合运用了多种指标判断趋势方向,并采用ATR智能跟踪来控制风险。这种策略可以有效过滤噪音别入场,具有较好的风险收益比。我们可以通过调整参数、修改止损方式以及增加过滤条件等方法来不断优化这一策略,使其能够适应更加复杂的市场环境。
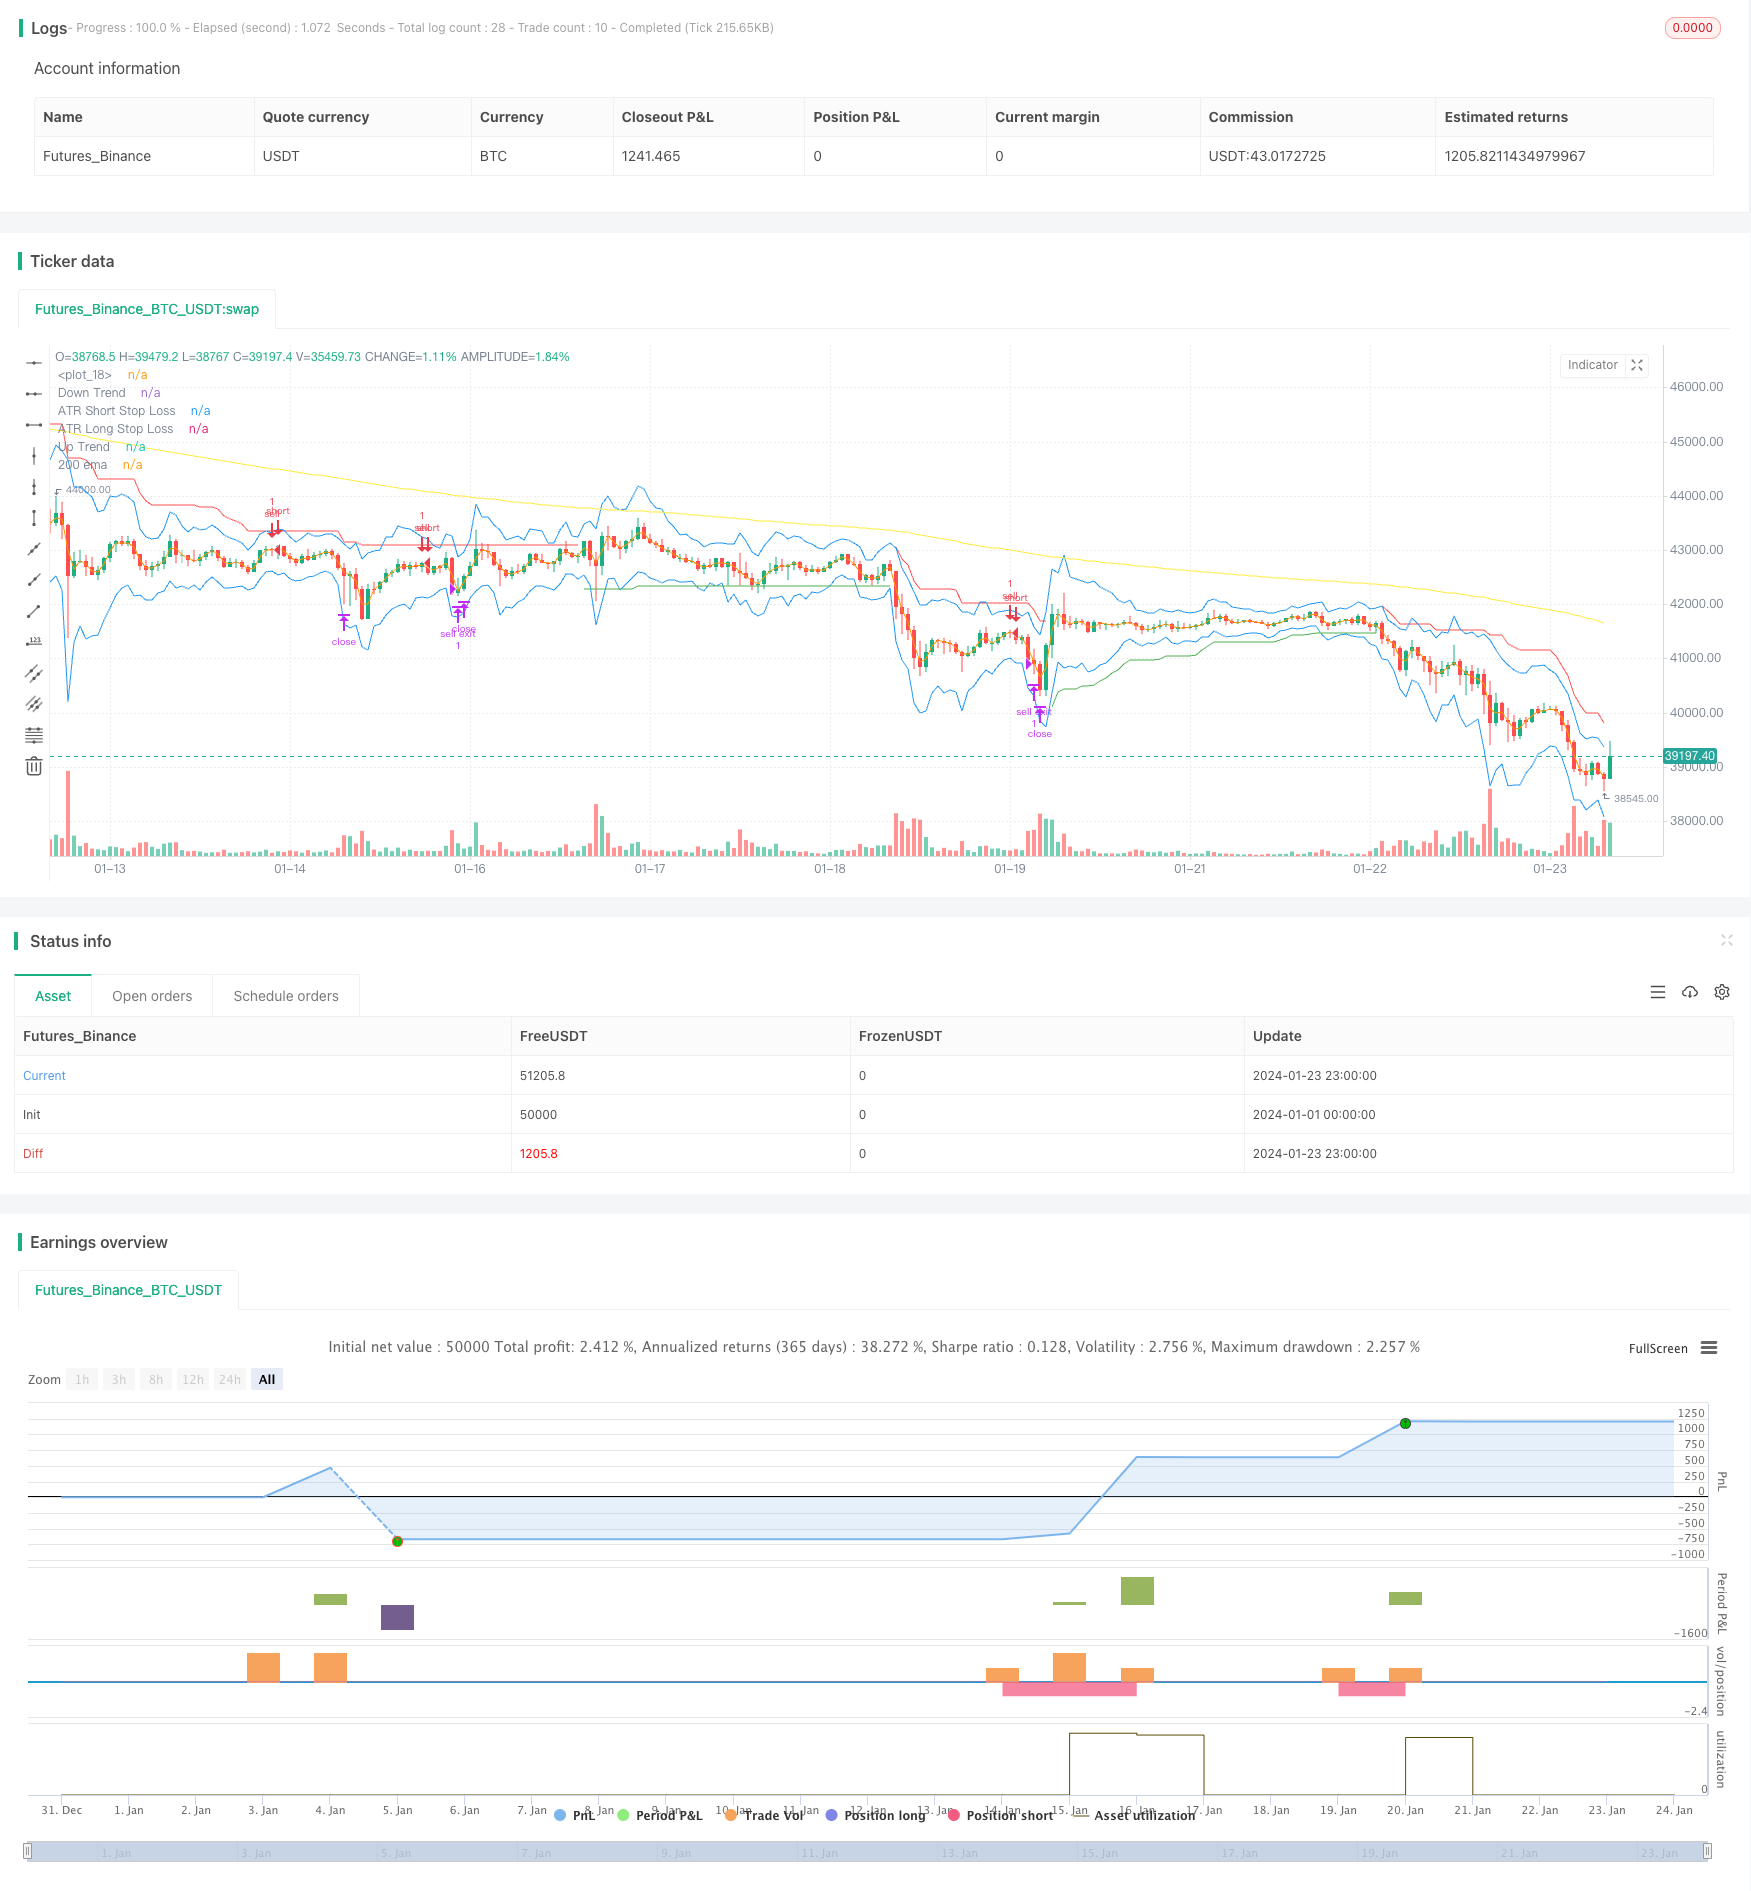
/*backtest
start: 2024-01-01 00:00:00
end: 2024-01-24 00:00:00
period: 1h
basePeriod: 15m
exchanges: [{"eid":"Futures_Binance","currency":"BTC_USDT"}]
*/

// This source code is subject to the terms of the Mozilla Public License 2.0 at https://mozilla.org/MPL/2.0/
// © araamas

//@version=5
strategy("stoch supertrd atr 200ma", overlay=true, process_orders_on_close=true)
var B = 0
if strategy.position_size > 0 //to figure out how many bars away did buy order happen
    B += 1

if strategy.position_size == 0
    B := 0

atrPeriod = input(10, "ATR Length")
factor = input.float(3.0, "Factor", step = 0.01)

[supertrend, direction] = ta.supertrend(factor, atrPeriod)

bodyMiddle = plot((open + close) / 2, display=display.none)
upTrend = plot(direction < 0 ? supertrend : na, "Up Trend", color = color.green, style=plot.style_linebr)
downTrend = plot(direction < 0? na : supertrend, "Down Trend", color = color.red, style=plot.style_linebr)

ema = ta.ema(close, 200)
plot(ema, title="200 ema", color=color.yellow)

b = input.int(defval=14, title="length k%")
d = input.int(defval=3, title="smoothing k%")
s = input.int(defval=3, title="smoothing d%")
smooth_k = ta.sma(ta.stoch(close, high, low, b), d)
smooth_d = ta.sma(smooth_k, s)

////////////////////////////////////////////////////////////////////////////////
length = input.int(title="Length", defval=12, minval=1)
smoothing = input.string(title="Smoothing", defval="SMA", options=["RMA", "SMA", "EMA", "WMA"])
m = input(1.5, "Multiplier")
src1 = input(high)
src2 = input(low)
pline = input(true, "Show Price Lines")
col1 = input(color.blue, "ATR Text Color")
col2 = input(color.teal, "Low Text Color",inline ="1")
col3 = input(color.red, "High Text Color",inline ="2")

collong = input(color.teal, "Low Line Color",inline ="1")
colshort = input(color.red, "High Line Color",inline ="2")

ma_function(source, length) =>
	if smoothing == "RMA"
		ta.rma(source, length)
	else
		if smoothing == "SMA"
			ta.sma(source, length)
		else
			if smoothing == "EMA"
				ta.ema(source, length)
			else
				ta.wma(source, length)

a = ma_function(ta.tr(true), length) * m
x = ma_function(ta.tr(true), length) * m + src1
x2 = src2 - ma_function(ta.tr(true), length) * m

p1 = plot(x, title = "ATR Short Stop Loss", color=color.blue)
p2 = plot(x2, title = "ATR Long Stop Loss", color= color.blue)


///////////////////////////////////////////////////////////////////////////////////////////////

shortCondition = high < ema and direction == 1 and smooth_k > 80
if (shortCondition) and strategy.position_size == 0
    strategy.entry("sell", strategy.short)

longCondition = low > ema and direction == -1 and smooth_k < 20
if (longCondition) and strategy.position_size == 0
    strategy.entry("buy", strategy.long)

g = (strategy.opentrades.entry_price(0)-x2) * 2
k = (x - strategy.opentrades.entry_price(0)) * 2

if strategy.position_size > 0
    strategy.exit(id="buy exit", from_entry="buy",limit=strategy.opentrades.entry_price(0) + g, stop=x2)

if strategy.position_size < 0
    strategy.exit(id="sell exit", from_entry="sell",limit=strategy.opentrades.entry_price(0) - k, stop=x)

//plot(strategy.opentrades.entry_price(0) - k, color=color.yellow)
//plot(strategy.opentrades.entry_price(0) + g, color=color.red)