概述
该策略结合了移动平均线和交易量两个关键技术指标,设计了长仓和短仓的入场和退出规则,形成一个完整的量化交易策略。
策略原理
关键指标
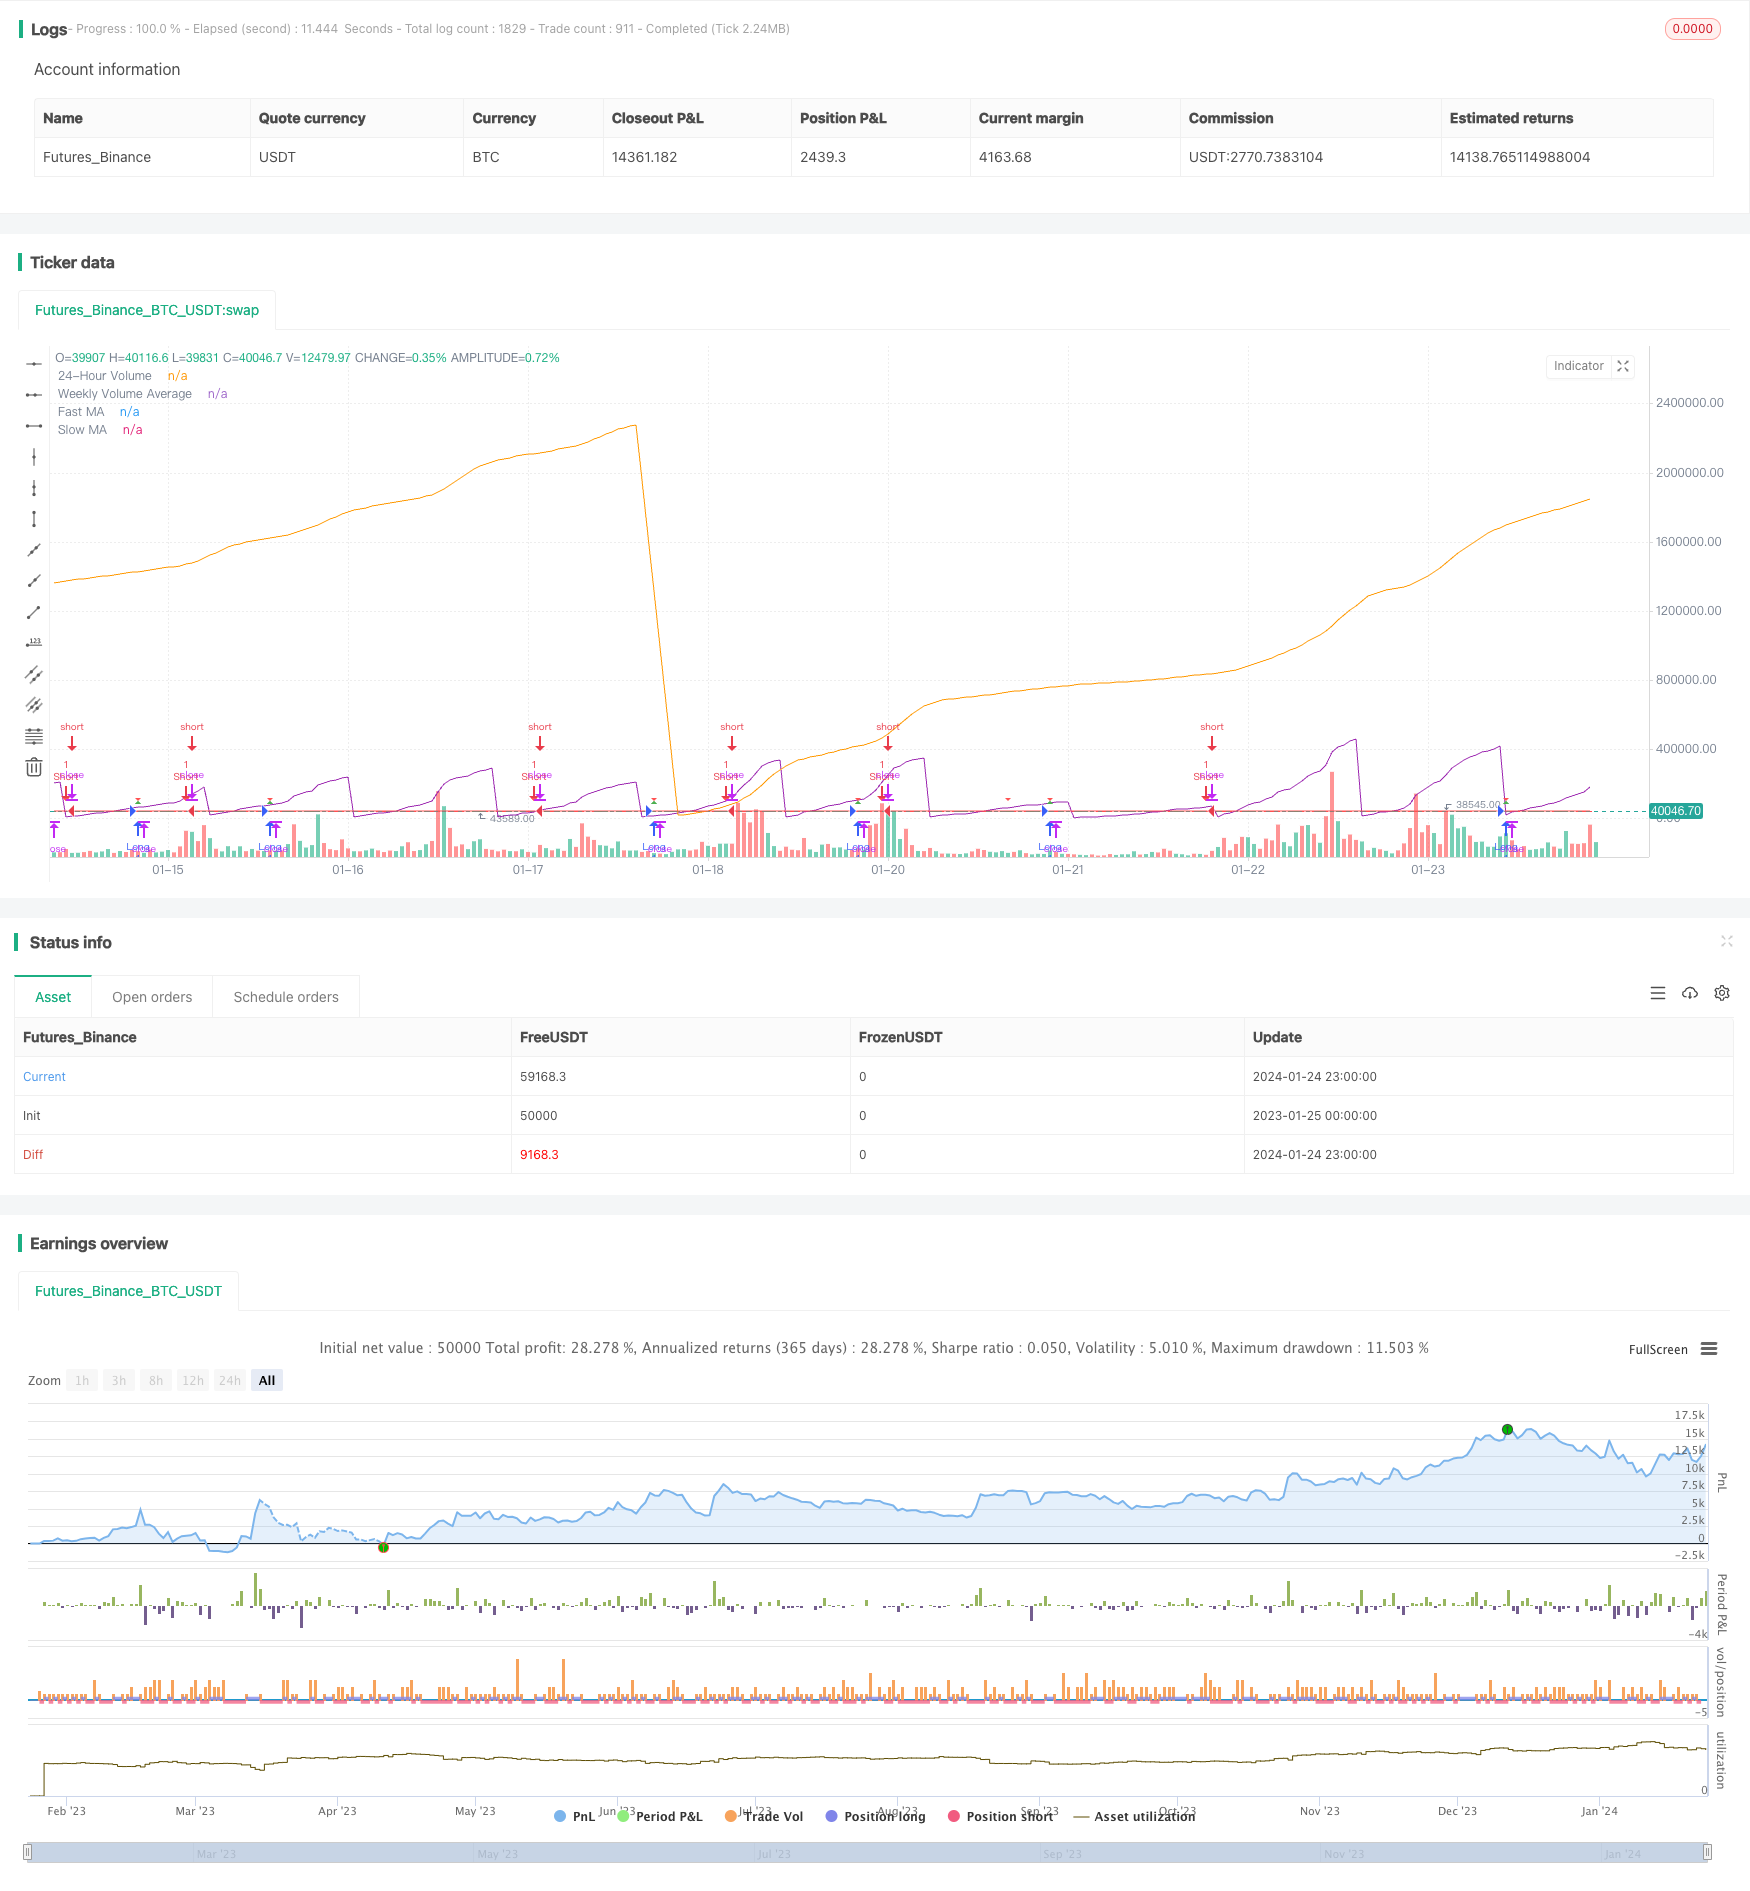
- 移动平均线:快速移动平均线(蓝线)和慢速移动平均线(红线)。
- 交易量:24小时交易量(紫色)和7天平均交易量(橙线)。
策略条件
长仓入场条件: 1. 快速移动平均线上穿慢速移动平均线 2. 24小时交易量低于7天平均交易量的50%
短仓入场条件:
快速移动平均线下穿慢速移动平均线
入场和退出
长仓入场:满足长仓入场条件时做多
短仓入场:满足短仓入场条件时做空
止盈和止损: 显示做多后的止盈位和止损位
优势分析
- 结合价格指标和交易量指标,避免假突破
- 清晰的入场和退出规则
- 有止盈止损机制控制风险
风险分析
- 双均线策略容易产生频繁交易
- 交易量数据质量无法保证
- 参数优化存在过优化风险
改进方法:
- 适当调整均线参数,减少交易频率
- 结合更多数据源验证量化信号
- 严格的回测验证,防止过优化
优化方向
- 增加其他指标过滤信号
- 动态调整止盈止损位
- 多时间框架分析,提高稳定性
总结
该策略整合移动平均线指标和交易量指标,通过双确认机制设计了完整的量化交易策略。具有入场条件清晰,有止盈止损,简单可操作的优点。同时也要防止双均线策略的频繁交易问题,关注交易量数据质量,防止参数过优化。NEXT步进行多指标优化,动态止盈止损以及多时间框架分析。
策略源码
/*backtest
start: 2023-01-25 00:00:00
end: 2024-01-25 00:00:00
period: 1h
basePeriod: 15m
exchanges: [{"eid":"Futures_Binance","currency":"BTC_USDT"}]
*/

//@version=5
strategy("MA and Volume Strategy", overlay=true)

// Input parameters
fastLength = input(9, title="Fast MA Length")
slowLength = input(21, title="Slow MA Length")
volumePercentageThreshold = input(50, title="Volume Percentage Threshold")

// Calculate moving averages
fastMA = ta.sma(close, fastLength)
slowMA = ta.sma(close, slowLength)

// Calculate 24-hour volume and weekly volume average
dailyVolume = request.security(syminfo.tickerid, "D", volume)
weeklyVolumeAvg = ta.sma(request.security(syminfo.tickerid, "W", volume), 7)

// Strategy conditions
longCondition = ta.crossover(fastMA, slowMA) and dailyVolume < (weeklyVolumeAvg * volumePercentageThreshold / 100)
shortCondition = ta.crossunder(fastMA, slowMA)

// Set take profit and stop loss levels
takeProfitLong = close * 1.50
stopLossLong = close * 0.90

// Strategy orders
strategy.entry("Long", strategy.long, when=longCondition)
strategy.entry("Short", strategy.short, when=shortCondition)

// Plot moving averages
plot(fastMA, color=color.blue, title="Fast MA")
plot(slowMA, color=color.red, title="Slow MA")

// Plot 24-hour volume and weekly volume average
plot(dailyVolume, color=color.purple, title="24-Hour Volume", transp=0)
plot(weeklyVolumeAvg, color=color.orange, title="Weekly Volume Average")

// Plot entry signals
plotshape(series=longCondition, title="Buy Signal", color=color.green, style=shape.triangleup, size=size.small)
plotshape(series=shortCondition, title="Sell Signal", color=color.red, style=shape.triangledown, size=size.small)

// Plot take profit and stop loss levels only when a valid trade is active
plotshape(series=longCondition, title="Take Profit Long", color=color.green, style=shape.triangleup, size=size.small)
plotshape(series=longCondition, title="Stop Loss Long", color=color.red, style=shape.triangledown, size=size.small)