概述
黄金交叉移动平均线策略是一种基于移动平均线的趋势跟踪策略。该策略通过计算不同周期的移动平均线,判断市场的趋势方向,并据此产生交易信号。具体来说,该策略计算50日线、100日线和200日线这三条移动平均线,当短期均线从下向上突破长期均线时,产生买入信号;当短期均线从上向下跌破长期均线时,产生卖出信号。
策略原理
该策略的核心信号来自移动平均线的黄金交叉。所谓黄金交叉,是指短期移动平均线从下向上突破长期移动平均线,表明市场步入多头趋势的信号。该策略以50日线为短期均线,200日线为长期均线,等待两条均线发生黄金交叉时买入;以50日线为短期均线,100日线为长期均线,等待短期均线下穿长期均线时卖出,完成一次交易周期。
通过设置不同参数的移动平均线,可以更好地捕捉市场趋势的转折点。短期均线能更快地响应价格变化,反映最近期价格行情;长期均线对短期波动不敏感,可以确定主要趋势方向。两条均线间形成黄金交叉,可以有效确认趋势转折,产生交易信号。
策略优势分析
该策略具有以下优势:
趋势跟踪能力强。双移动平均线策略可以顺应市场主要趋势,避免被短期市场噪音干扰,具有较强的趋势跟踪能力。
交易信号明确。策略完全依赖移动平均线的关系形成交易信号,信号产生和解释非常明确直接,避免主观判断错误。
容易实施回测。作为一种典型的趋势跟踪策略,该策略可以快速实施回测,评估策略效果。
可扩展空间大。移动平均线参数、交易品种、时间周期等都可以优化扩展,寻找更好的参数组合。
风险分析
该策略也存在一些风险:
错过转折点。移动平均线本质具有滞后性,不能准确定位重要转折点,可能错过最佳买入时机。
产生多头假信号。短期内可能出现多次黄金交叉假信号,使投资者产生误判。
突发事件风险。重大突发事件可能导致市场产生剧烈波动,移动平均线策略难以应对这类异常情况。
大盘震荡风险。当市场长期处于宽幅震荡状态时,该策略可能产生过多无效信号,导致操作频繁但总体收益微弱。
这些风险可以通过调整移动平均线参数,设置止损策略,或与其他指标组合使用来规避。
优化方向
该策略可以从以下几个方面进行优化:
优化移动平均线参数,找到最佳参数组合。可以测试更多周期参数,也可以引入三指数移动平均线等自适应均线。
增加止损策略,以控制单笔损失。移动止损或比例止损都可以避免损失进一步扩大。
结合其他指标过滤信号。双移动平均线信号可与成交量、波动率等指标组合,确保只在趋势性强的情况下产生交易。
利用机器学习技术进行策略优化。通过算法自动搜索更优的参数组合和交易规则,不断迭代提高策略收益率。
总结
黄金交叉移动平均线策略通过计算双移动平均线的关系,判断市场主要趋势方向,以捕捉中长线趋势机会。该策略优点是信号判断规则清晰,容易实施和优化,适合中长线投资者使用。我们也应注意该策略的滞后性和可能产生的假信号,采取组合和优化措施来规避潜在风险。
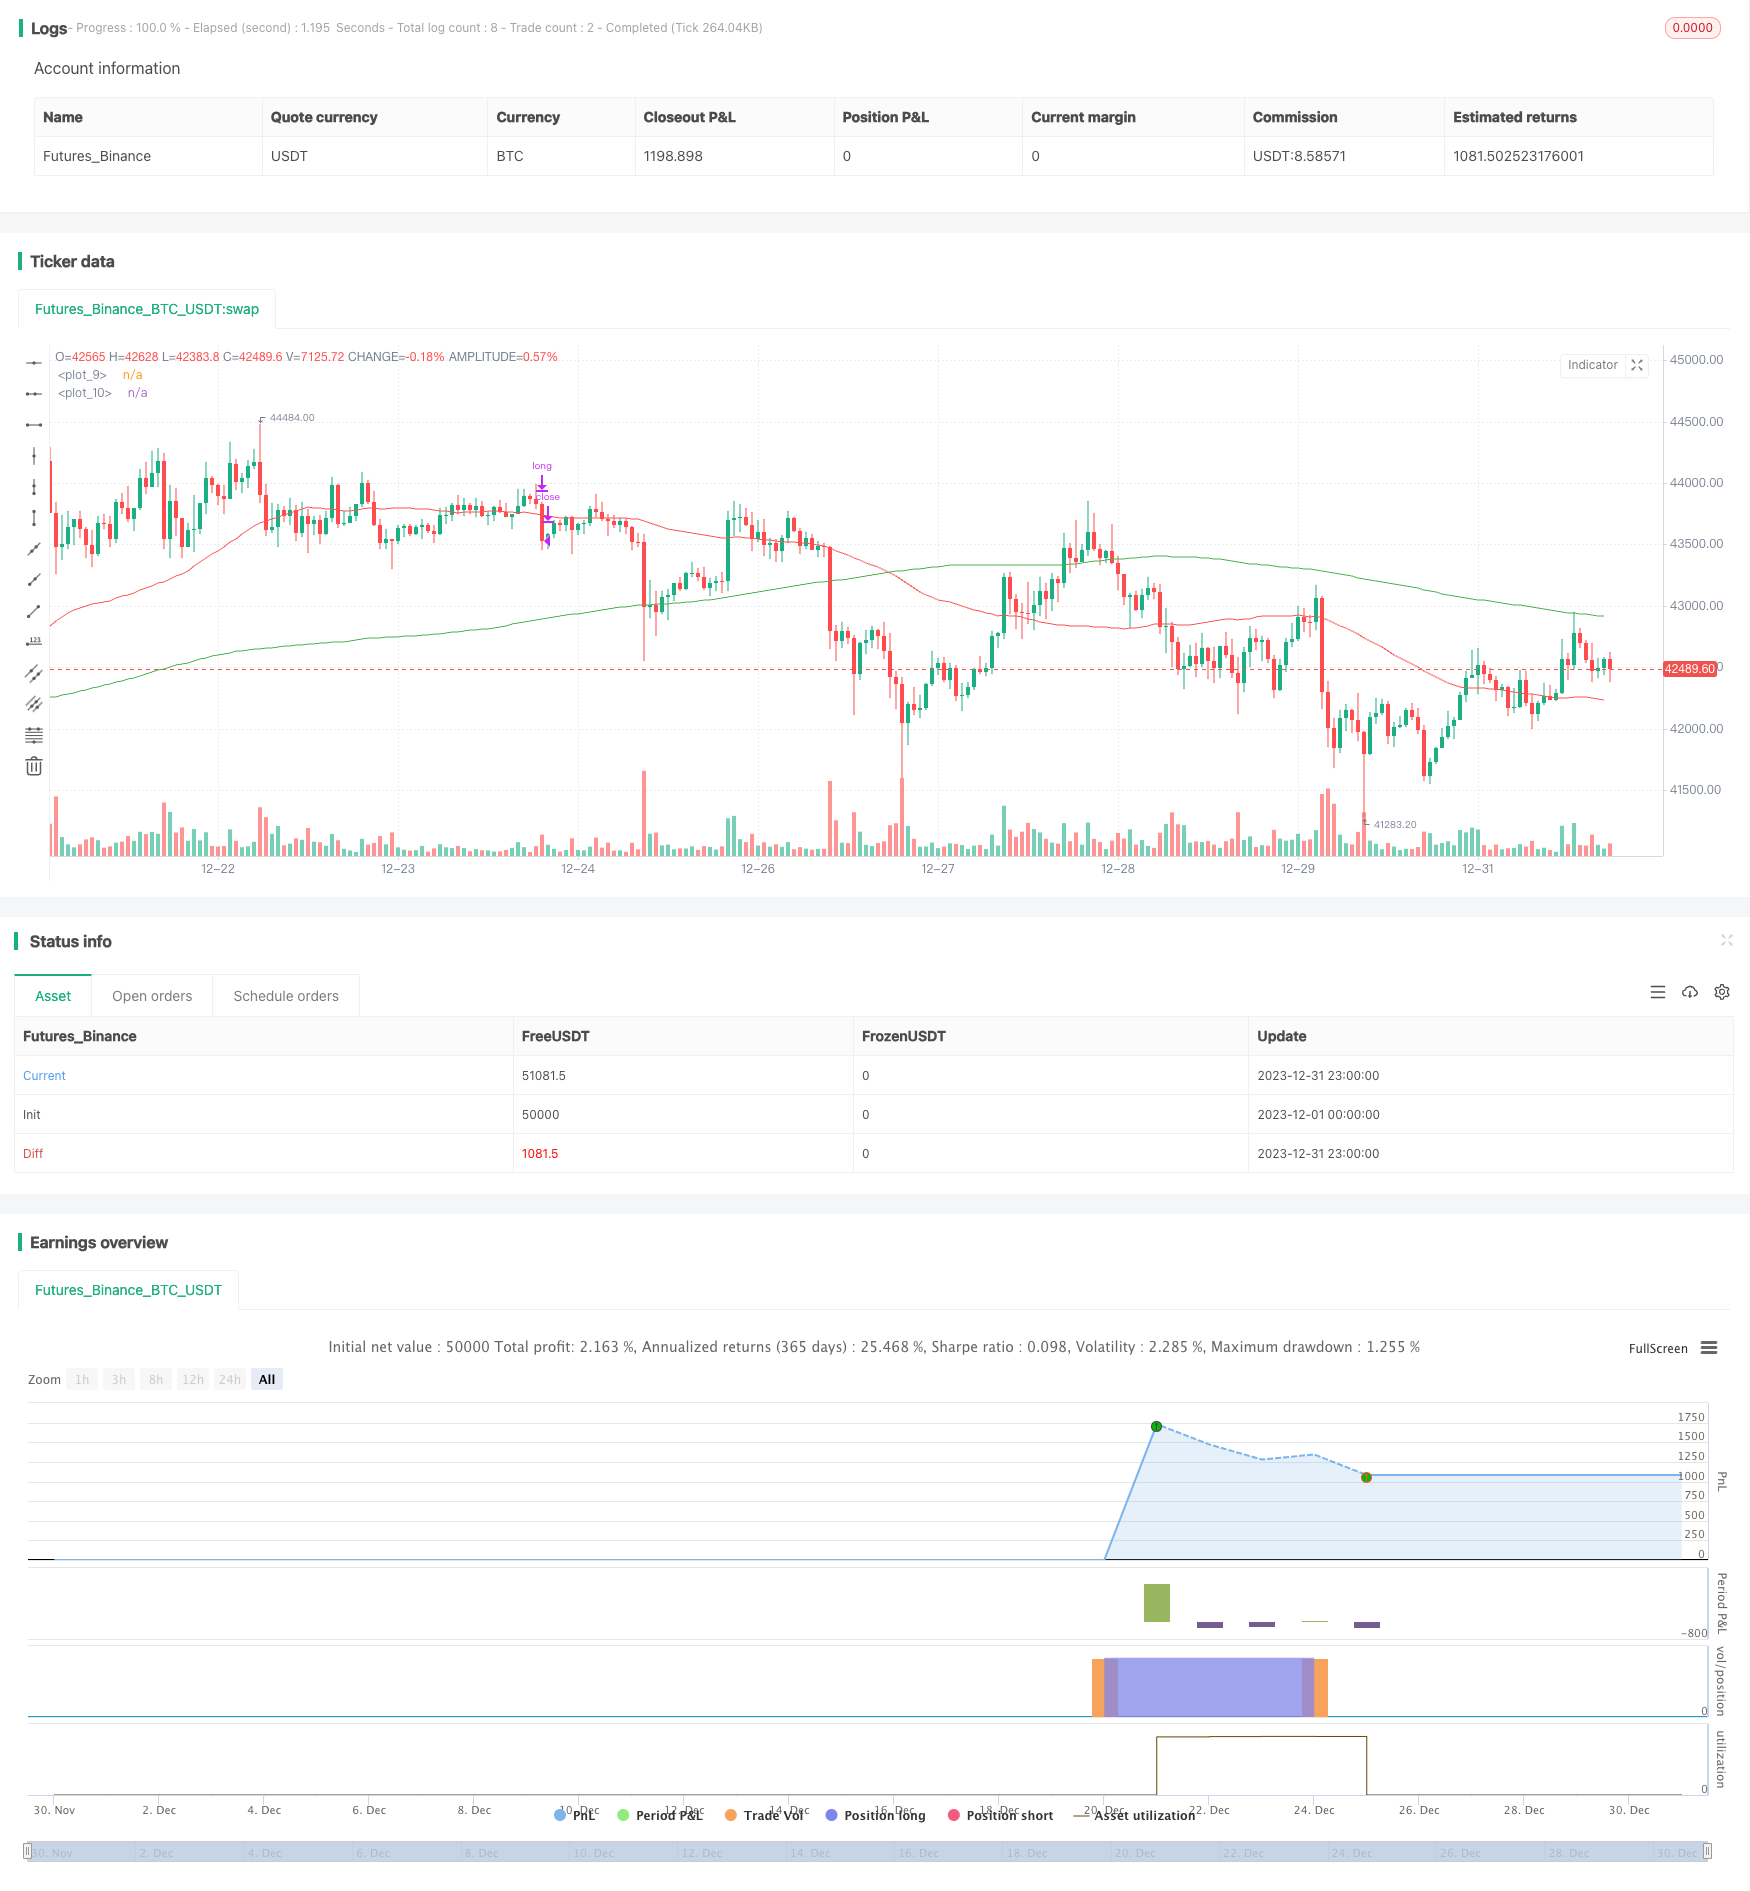
/*backtest
start: 2023-12-01 00:00:00
end: 2023-12-31 23:59:59
period: 1h
basePeriod: 15m
exchanges: [{"eid":"Futures_Binance","currency":"BTC_USDT"}]
*/

//@version=4
strategy(title="MA Cross", overlay=true)
short = sma(close, 50)
short1 = sma(close[5], 50)
medium = sma(close, 100)
long = sma(close, 200)
long1 = sma(close[5], 200)

plot(short, color = color.red)
plot(long, color = color.green)
trendUp = (cross(short, long) and (long1 > short1) ? true : false)
x = if (trendUp)
    (long1 - short1)*5
else
    0

//start     = timestamp(2000, 01, 01, 00, 00)        // backtest start window
//finish    = timestamp(2020, 02, 09, 23, 59)        // backtest finish window
//window()  => time >= start and time <= finish ? true : false

//strategy.entry("long", true, 1000, limit = high, when = window() and trendUp)
//strategy.close("long", when = window() and close < medium)

strategy.entry("long", true, 1, limit = high, when = trendUp)
strategy.close("long", when = close < medium)