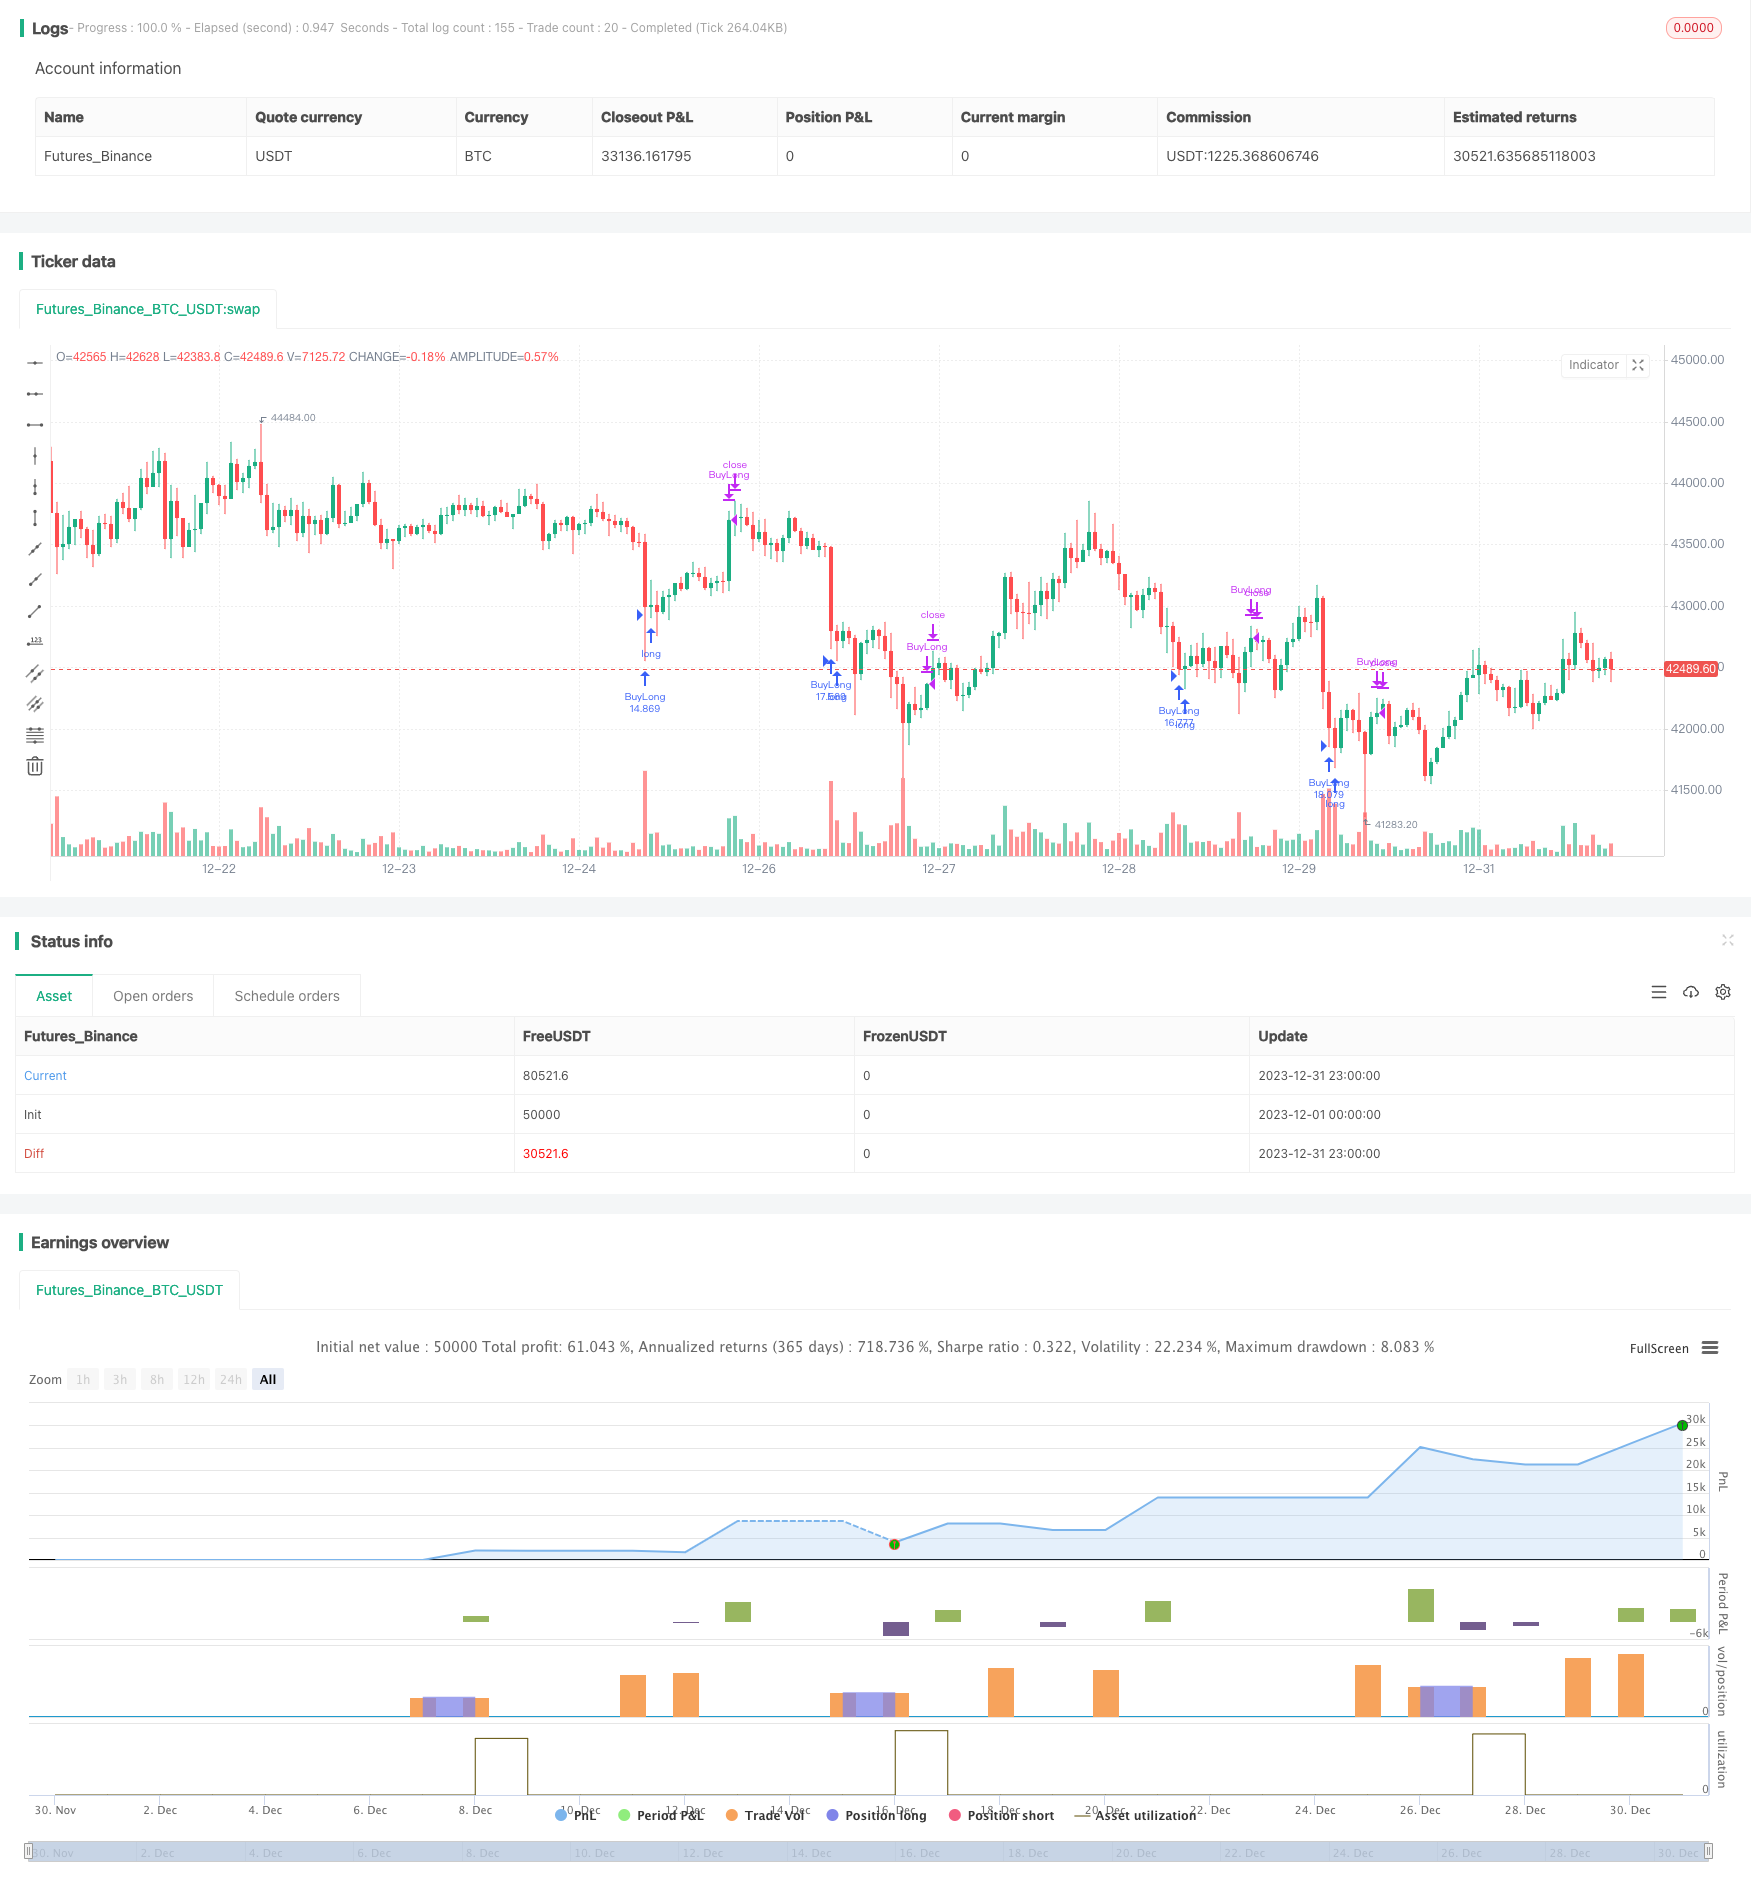
Dynamic Bollinger Breakout Strategy

Author: ChaoZhang, Date: 2024-01-26 14:52:59
Tags:

img

Overview

This strategy is a breakout trading strategy based on the Bollinger Bands indicator. It calculates the upper and lower rails of the Bollinger Bands and combines them with dynamically adjustable buy and sell thresholds to automate trading of BTCUSDT on Binance.

Strategy Logic

The core indicator of this strategy is Bollinger Bands. Bollinger Bands consist of an N-day moving average and upper and lower bands plotted at a standard deviation level above and below it. The Bollinger Bands in this strategy have a length of 20 days and a standard deviation multiplier of 2. When the price approaches or touches the lower rail of the Bollinger Bands, it is considered oversold, and the strategy will open a long position. When the price approaches or touches the upper rail, it is considered overbought, and the strategy will close long positions.

In addition to the Bollinger Bands indicator, this strategy also introduces two adjustable parameters: buy threshold and sell threshold. The buy threshold defaults to 58 points below the lower band and serves as the entry condition for opening long positions. The sell threshold defaults to 470 points above the lower band and serves as the exit condition for closing positions. These thresholds can be dynamically adjusted based on actual market conditions and backtest results to make the strategy more flexible.

When the buy condition is met, the strategy will open a long position using 10% of the account equity. After opening the long position, if the price rises to hit the stop loss level (-125%), positions will be closed by stop loss orders. When the price rises to trigger the sell threshold, the strategy will choose to close all positions to collect profits.

Advantage Analysis

The main advantages of this strategy include:

  1. Using Bollinger Bands can capture opportunities when prices abnormally deviate from bands and profit from reversals
  2. Introducing adjustable buy and sell thresholds optimizes entry and exit points
  3. Taking partial position sizes controls risk
  4. Setting stop loss condition avoids further losses
  5. Backtesting with 5-min intervals can capture short-term trading opportunities in a timely manner

Risk Analysis

There are also some risks with this strategy:

  1. Bollinger Bands itself is not 100% reliable, prices may oscillate lower for a long time before dropping again
  2. Improper threshold settings may cause missing the best entry or exit points
  3. Stop loss setting too loose may fail to stop loss in time, or too tight may cause stop loss too sensitive
  4. Improper backtesting period selection may take some occasional profits as stable income

Countermeasures:

  1. Combine more indicators to judge market conditions and avoid false signals of Bollinger Bands
  2. Test and optimize threshold parameters to find optimal combination
  3. Test and optimize stop loss conditions to find a balance
  4. Adopt longer backtesting period to examine stability of the strategy

Optimization Directions

The strategy can be further optimized in the following aspects:

  1. Try combining other indicators like KD, RSI to set stricter entry rules, avoid entering too early or too late
  2. Test different combinations of Bollinger Bands parameters to optimize band length and standard deviation multiplier
  3. Optimize buy and sell thresholds to improve profit rate
  4. Try adopting dynamic ATR-based stop loss ratio to match market volatility
  5. Optimize position sizing, e.g. appropriately pyramiding positions when in profit to control single loss risk

Summary

In summary, this is an overall simple and practical breakout strategy. It adopts Bollinger Bands to identify reversal opportunities and sets dynamic thresholds for entry and exit. Meanwhile, reasonable position sizing and stop loss conditions are utilized to control risks. After optimizing several key parameters, this strategy can yield relatively steady returns. It is suitable for algorithmic trading and can also serve as an auxiliary tool for stock picking or gauging market sentiment. Generally speaking, this strategy has strong practicality and extensibility.


/*backtest
start: 2023-12-01 00:00:00
end: 2023-12-31 23:59:59
period: 1h
basePeriod: 15m
exchanges: [{"eid":"Futures_Binance","currency":"BTC_USDT"}]
*/

// This source code is subject to the terms of the Mozilla Public License 2.0 at https://mozilla.org/MPL/2.0/
// © SuperDS_BTC

//@version=5
strategy("布林通道策略多5min", overlay=true) 

// 布林通道计算
length = input(20, title="布林通道周期")
mult = input(2.0, title="标准差倍数")
basis = ta.sma(close, length)
dev = mult * ta.stdev(close, length)
upper = basis + dev
lower = basis - dev

// 计算买入数量:每次检查仓位的大小 
// 每次买入使用总资金的10%
position_size = strategy.equity * 10 / close 

// 定義可調整的閾值
buy_threshold = input(58, title="買入閾值")
exit_threshold = input(470, title="賣出閾值")

// 买入条件:当现价低于布林通道的下限减去 buy_threshold
buy_condition = close < lower - buy_threshold

// 卖出条件和结清仓位条件
exit_condition = close > lower + exit_threshold

// 买入逻辑
if buy_condition
    strategy.entry("BuyLong", strategy.long, qty=position_size, comment="LongBTC")

// 卖出逻辑
if exit_condition
    strategy.close("BuyLong")

// 止损逻辑
stop_loss_percent = -1.25 //止损百分比为-125%
if strategy.position_size > 0
    position_profit_percent = (strategy.position_avg_price - close) / strategy.position_avg_price * 100
    if position_profit_percent <= stop_loss_percent
        strategy.close("BuyLong")

More