概述
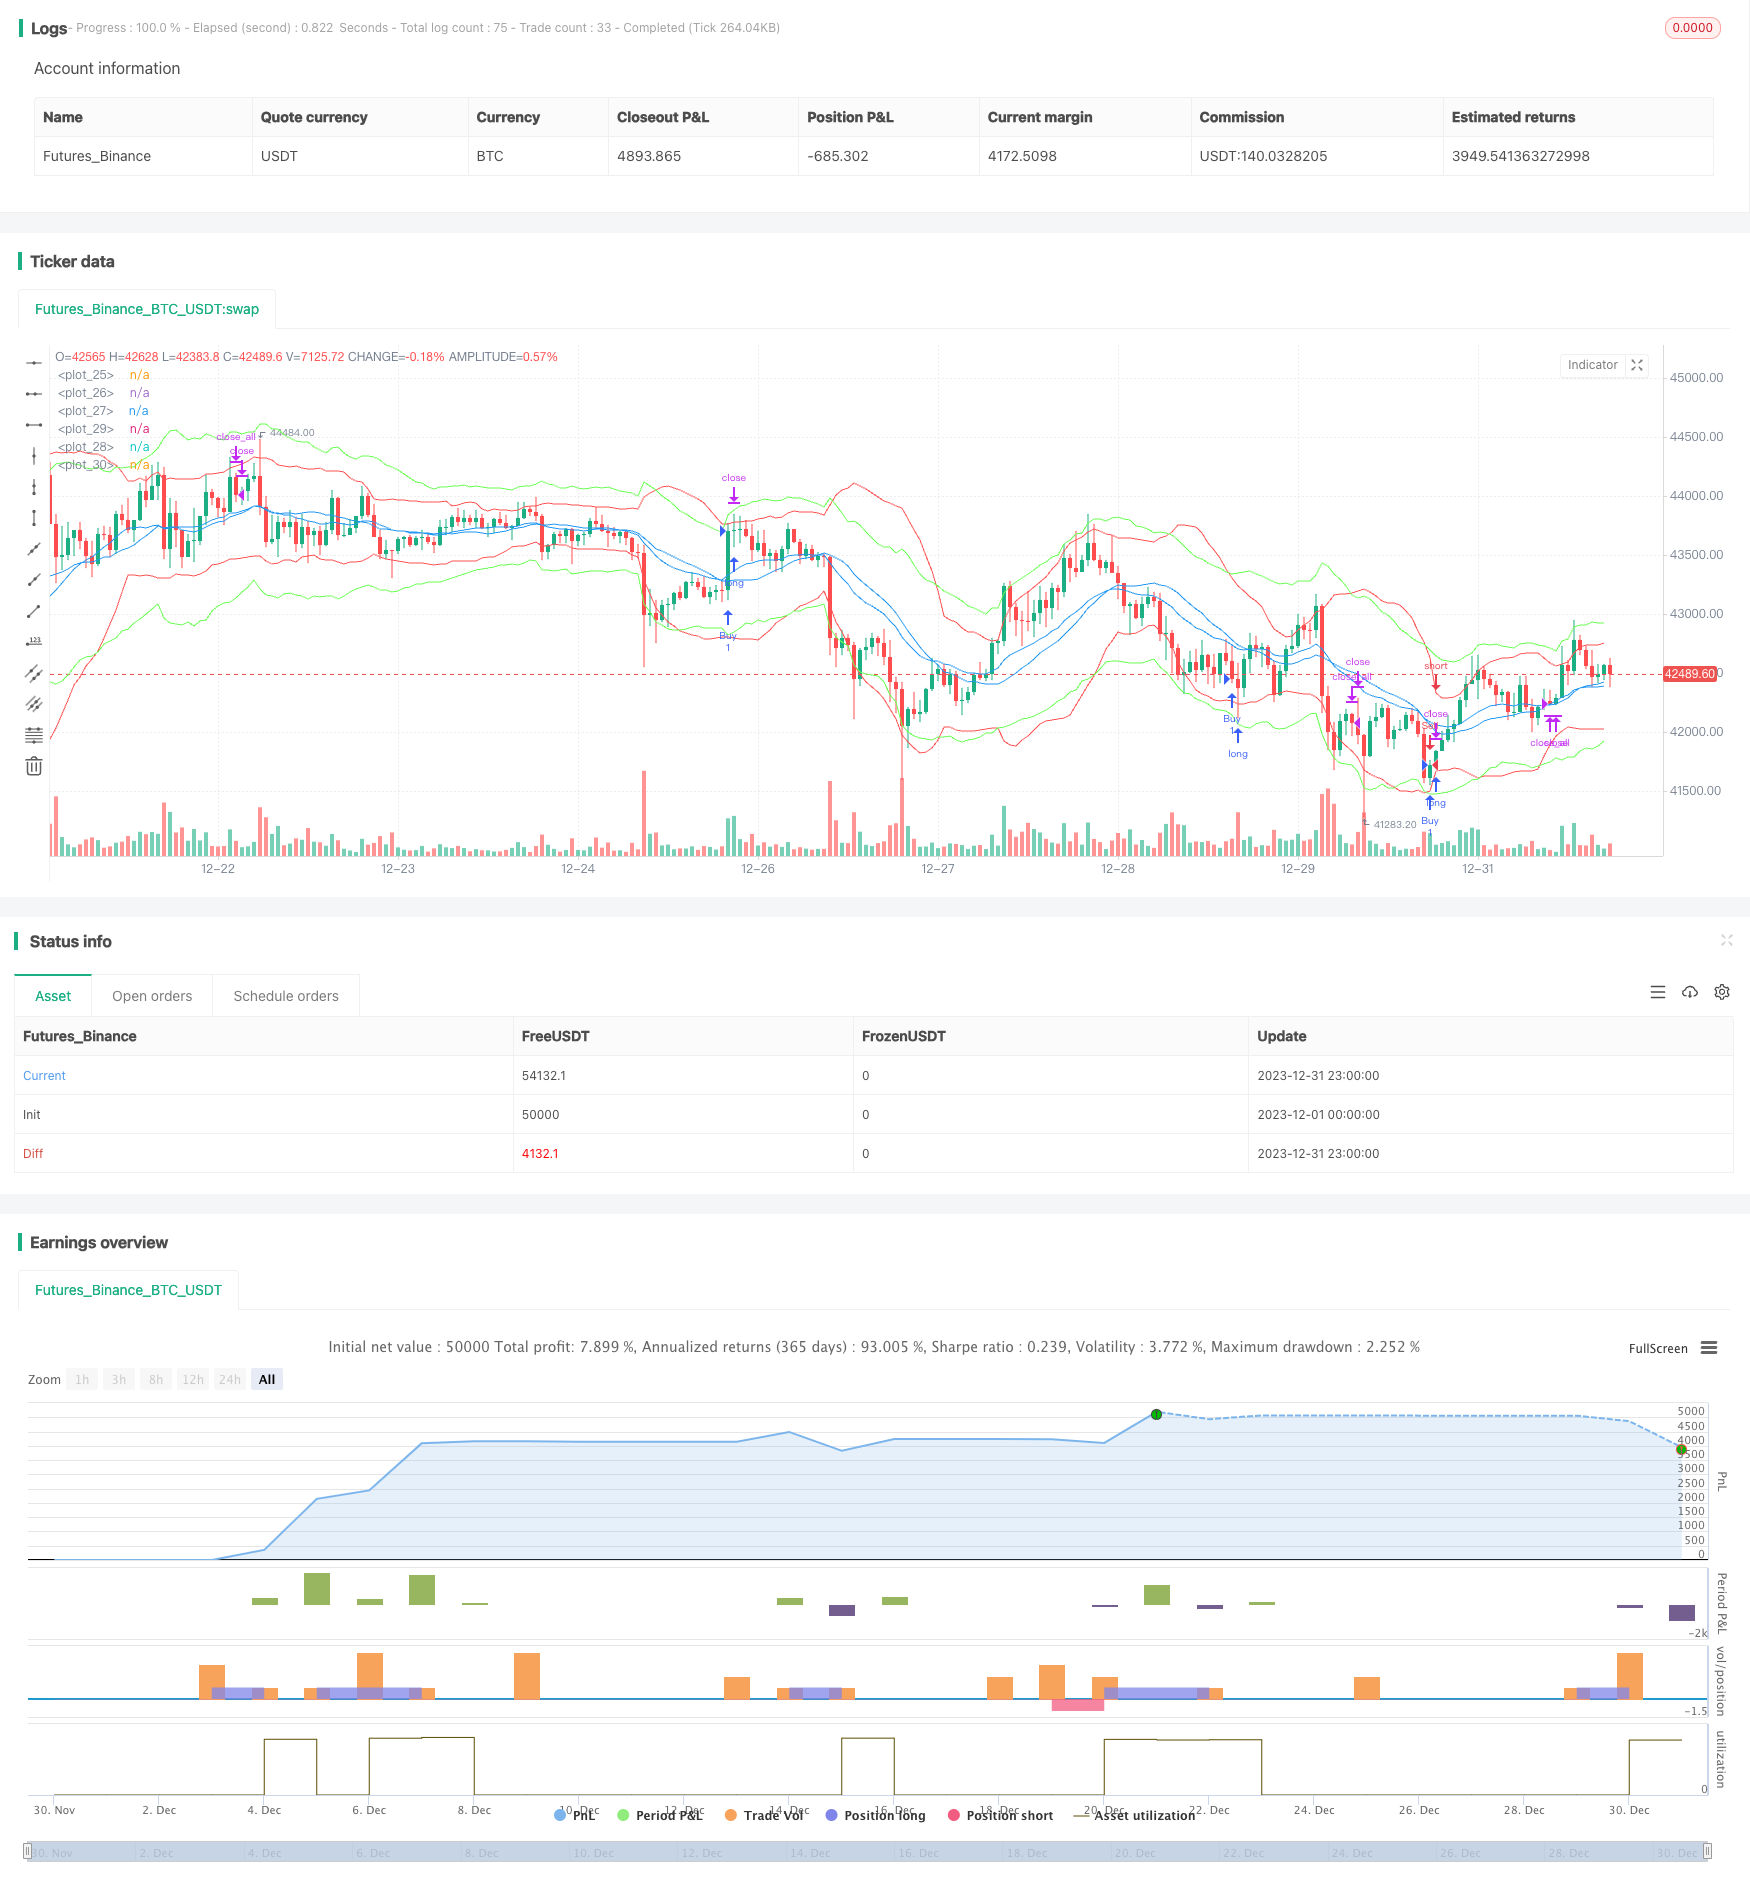
本策略使用布林带和凯特线信号组合识别市场趋势,布林带是根据价格波动范围来界定通道的技术分析工具;凯特线信号是将价格波动性与趋势性结合来判断支撑或压力的技术指标。该策略综合利用两种指标的优势,通过判断布林带和凯特线是否发生黄金交叉来寻找做多做空机会,同时结合成交量的情况来验证信号,能够有效识别趋势的开始,并最大程度压缩无效信号。
策略原理
- 计算20周期的布林中轨、上轨和下轨,带宽通过标准差的2倍来规定。
- 计算20周期的凯特中轨、上轨和下轨,带宽通过真实波动范围的2.2倍来规定。
- 当凯特线上轨上穿布林带上轨,且成交量大于10周期平均量时,做多。
- 当凯特线下轨下穿布林带下轨,且成交量大于10周期平均量时,做空。
- 开仓后20根K线没有退出,则强制止盈止损退出。
- 做多后设置1.5%的止损,做空后设置-1.5%的止损;做多后设置2%的跟踪止损,做空后设置-2%的跟踪止损。
该策略主要依靠布林带判断波动范围和力度,利用凯特线辅助验证,两种不同参数但性质相似的指标联合使用,可以提高信号的准确性,成交量的引入也可有效地减少无效信号。
优势分析
- 综合利用布林带和凯特线两种指标的优势,提高了交易信号准确性。
- 结合成交量指标,可有效减少市场频繁撞线的无效信号。
- 设置止损和跟踪止损机制,能够有效控制风险。
- 无效信号后的强制止盈止损设定,可快速止损止盈。
风险分析
- 布林带和凯特线均是以移动均线为基础并结合波动性计算的指标,在震荡行情中容易产生误信号。
- 无复利机制,多次被套住可能导致亏损过大。
- 反转信号较常见,调整参数后容易丢失趋势机会。 可以适当放宽止损幅度,或加入MACD等辅助指标筛选信号,以减少误信号带来的风险。
优化方向
- 可以测试不同参数对策略收益率的影响,如调整均线长度、标准差倍数等参数。
- 可以加入其他指标判断来确定信号,如KDJ指标或MACD指标的辅助。
- 可以通过机器学习方法自动优化参数。
总结
本策略综合运用布林带和凯特线指标来识别市场趋势,并辅以成交量指标来验证信号。通过参数优化、加入其他技术指标等方式可进一步强化该策略,使之能够适应更广泛的市场情况。该策略整体可行性较强,属于易于掌握和调整的量化交易策略之一。
策略源码
/*backtest
start: 2023-12-01 00:00:00
end: 2023-12-31 23:59:59
period: 1h
basePeriod: 15m
exchanges: [{"eid":"Futures_Binance","currency":"BTC_USDT"}]
*/

// This source code is subject to the terms of the Mozilla Public License 2.0 at https://mozilla.org/MPL/2.0/
// © jensenvilhelm

//@version=5
strategy("BB and KC Strategy", overlay=true)

// Define the input parameters for the strategy, these can be changed by the user to adjust the strategy
kcLength = input.int(20, "KC Length", minval=1) // Length for Keltner Channel calculation
kcStdDev = input.float(2.2, "KC StdDev") // Standard Deviation for Keltner Channel calculation
bbLength = input.int(20, "BB Length", minval=1) // Length for Bollinger Bands calculation
bbStdDev = input.float(2, "BB StdDev") // Standard Deviation for Bollinger Bands calculation
volumeLength = input.int(10, "Volume MA Length", minval=1) // Length for moving average of volume calculation
stopLossPercent = input.float(1.5, "Stop Loss (%)") // Percent of price for Stop loss
trailStopPercent = input.float(2, "Trail Stop (%)") // Percent of price for Trailing Stop
barsInTrade = input.int(20, "Bars in trade before exit", minval = 1) // Minimum number of bars in trade before considering exit

// Calculate Bollinger Bands and Keltner Channel
[bb_middle, bb_upper, bb_lower] = ta.bb(close, bbLength, bbStdDev) // Bollinger Bands calculation
[kc_middle, kc_upper, kc_lower] = ta.kc(close, kcLength, kcStdDev) // Keltner Channel calculation

// Calculate moving average of volume
vol_ma = ta.sma(volume, volumeLength) // Moving average of volume calculation

// Plotting Bollinger Bands and Keltner Channels on the chart
plot(bb_upper, color=color.red) // Bollinger Bands upper line
plot(bb_middle, color=color.blue) // Bollinger Bands middle line
plot(bb_lower, color=color.red) // Bollinger Bands lower line
plot(kc_upper, color=color.rgb(105, 255, 82)) // Keltner Channel upper line
plot(kc_middle, color=color.blue) // Keltner Channel middle line
plot(kc_lower, color=color.rgb(105, 255, 82)) // Keltner Channel lower line

// Define entry conditions: long position if upper KC line crosses above upper BB line and volume is above MA of volume
// and short position if lower KC line crosses below lower BB line and volume is above MA of volume
longCond = ta.crossover(kc_upper, bb_upper) and volume > vol_ma // Entry condition for long position
shortCond = ta.crossunder(kc_lower, bb_lower) and volume > vol_ma // Entry condition for short position

// Define variables to store entry price and bar counter at entry point
var float entry_price = na // variable to store entry price
var int bar_counter = na // variable to store bar counter at entry point

// Check entry conditions and if met, open long or short position
if (longCond)
    strategy.entry("Buy", strategy.long) // Open long position
    entry_price := close // Store entry price
    bar_counter := 1 // Start bar counter
if (shortCond)
    strategy.entry("Sell", strategy.short) // Open short position
    entry_price := close // Store entry price
    bar_counter := 1 // Start bar counter

// If in a position and bar counter is not na, increment bar counter
if (strategy.position_size != 0 and na(bar_counter) == false)
    bar_counter := bar_counter + 1 // Increment bar counter

// Define exit conditions: close position if been in trade for more than specified bars
// or if price drops by more than specified percent for long or rises by more than specified percent for short
if (bar_counter > barsInTrade) // Only consider exit after minimum bars in trade
    if (bar_counter >= barsInTrade)
        strategy.close_all() // Close all positions
    // Stop loss and trailing stop
    if (strategy.position_size > 0)
        strategy.exit("Sell", "Buy", stop=entry_price * (1 - stopLossPercent/100), trail_points=entry_price * trailStopPercent/100) // Set stop loss and trailing stop for long position
    else if (strategy.position_size < 0)
        strategy.exit("Buy", "Sell", stop=entry_price * (1 + stopLossPercent/100), trail_points=entry_price * trailStopPercent/100) // Set stop loss and trailing stop for short position