概述
双基指标跟随策略是一种数字货币量化交易策略。该策略通过结合123反转指标和Qstick指标两个基础指标的信号,产生交易信号,根据两个指标的一致性决定是否入场。
策略原理
该策略由两部分组成:
- 123反转指标
该指标的交易信号来自最后两个K线的收盘价。如果最后两个K线的收盘价出现反转(即收盘价从上涨转为下跌或从下跌转为上涨),且同时满足随机指标的条件,则产生交易信号。
具体来说,如果前两日收盘价下跌,今日收盘价上涨,同时9日随机慢线低于50,产生买入信号;如果前两日收盘价上涨,今日收盘价下跌,同时9日随机快线高于50,产生卖出信号。
- Qstick指标
该指标通过计算开盘价与收盘价的差值的简单移动平均,判断多头和空头的力量。其通过零轴的穿越产生交易信号。
如果Qstick上穿零轴,表示多头力量增加,产生买入信号;如果Qstick下穿零轴,表示空头力量增加,产生卖出信号。
双基指标跟随策略则综合考虑123反转指标和Qstick指标的交易信号,当两者信号一致时,采取相应的交易行动。
优势分析
双基指标跟随策略结合两个不同类型指标的信号,可以提高交易信号的准确性。相比单一指标,能够有效减少错误信号并获取更高胜率。
另外,该策略仅在两种指标信号一致时才入场,可以有效控制风险,防止双基差异常。
风险及解决方法
- 指标信号产生时间存在差异,无法完美配合
可以通过参数优化,调整两个指标的参数,使其信号产生的频率和节奏更加协调。
- 双基差异常导致超短线运行
可以设置最小持仓周期,避免频繁撤销委托和建立委托。
优化方向
对两个指标的长度参数进行优化,找到最佳参数组合
测试不同的随机指标参数配置
3.加入止损策略
总结
双基指标跟随策略通过组合多个基础指标的优势,能够提高信号质量,在控制风险的同时获取较高收益。该策略有进一步参数优化和策略优化的空间,通过测试可以使策略更加稳定可靠。
策略源码
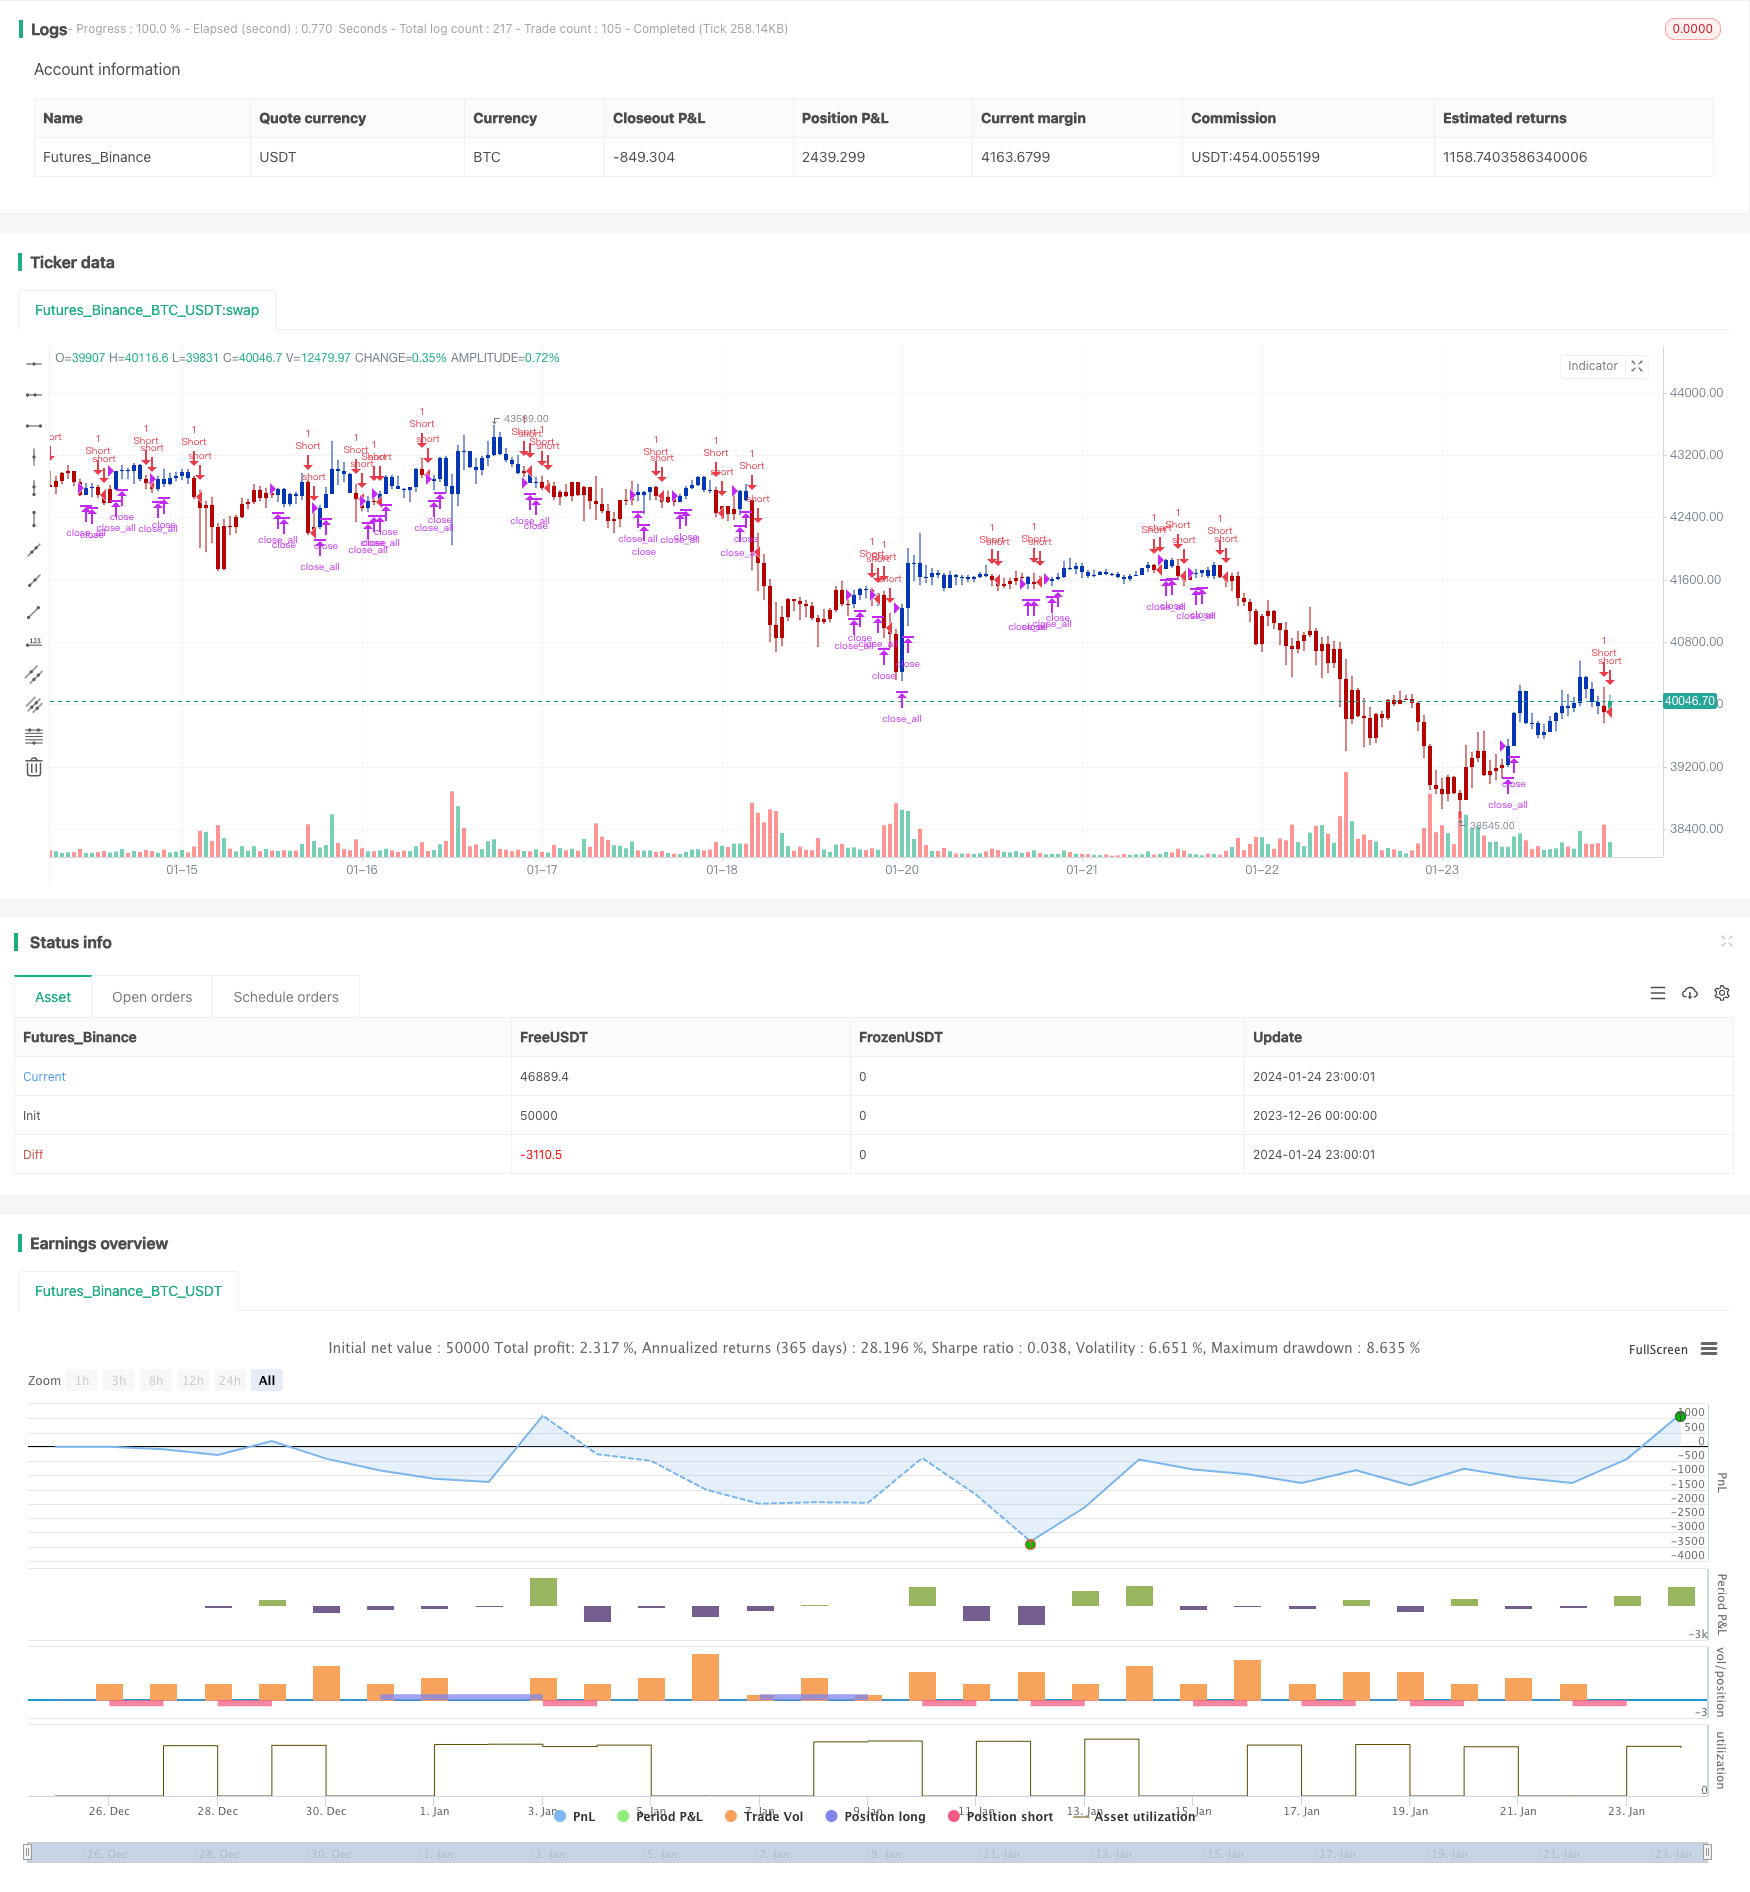
/*backtest
start: 2023-12-26 00:00:00
end: 2024-01-25 00:00:00
period: 1h
basePeriod: 15m
exchanges: [{"eid":"Futures_Binance","currency":"BTC_USDT"}]
*/

//@version=4
////////////////////////////////////////////////////////////
//  Copyright by HPotter v1.0 24/05/2021
// This is combo strategies for get a cumulative signal.
//
// First strategy
// This System was created from the Book "How I Tripled My Money In The
// Futures Market" by Ulf Jensen, Page 183. This is reverse type of strategies.
// The strategy buys at market, if close price is higher than the previous close
// during 2 days and the meaning of 9-days Stochastic Slow Oscillator is lower than 50.
// The strategy sells at market, if close price is lower than the previous close price
// during 2 days and the meaning of 9-days Stochastic Fast Oscillator is higher than 50.
//
// Second strategy
// A technical indicator developed by Tushar Chande to numerically identify
// trends in candlestick charting. It is calculated by taking an 'n' period
// moving average of the difference between the open and closing prices. A
// Qstick value greater than zero means that the majority of the last 'n' days
// have been up, indicating that buying pressure has been increasing.
// Transaction signals come from when the Qstick indicator crosses through the
// zero line. Crossing above zero is used as the entry signal because it is indicating
// that buying pressure is increasing, while sell signals come from the indicator
// crossing down through zero. In addition, an 'n' period moving average of the Qstick
// values can be drawn to act as a signal line. Transaction signals are then generated
// when the Qstick value crosses through the trigger line.
//
// WARNING:
// - For purpose educate only
// - This script to change bars colors.
////////////////////////////////////////////////////////////
Reversal123(Length, KSmoothing, DLength, Level) =>
    vFast = sma(stoch(close, high, low, Length), KSmoothing)
    vSlow = sma(vFast, DLength)
    pos = 0.0
    pos := iff(close[2] < close[1] and close > close[1] and vFast < vSlow and vFast > Level, 1,
	         iff(close[2] > close[1] and close < close[1] and vFast > vSlow and vFast < Level, -1, nz(pos[1], 0)))
	pos


Qstick(Length) =>
    pos = 0.0
    xR = close - open
    xQstick = sma(xR, Length)
    pos:= iff(xQstick > 0, 1,
           iff(xQstick < 0, -1, nz(pos[1], 0)))
    pos

strategy(title="Combo Backtest 123 Reversal & Qstick Indicator", shorttitle="Combo", overlay = true)
line1 = input(true, "---- 123 Reversal ----")
Length = input(14, minval=1)
KSmoothing = input(1, minval=1)
DLength = input(3, minval=1)
Level = input(50, minval=1)
//-------------------------
line2 = input(true, "---- Qstick Indicator ----")
LengthQ = input(14, minval=1)
reverse = input(false, title="Trade reverse")
posReversal123 = Reversal123(Length, KSmoothing, DLength, Level)
posQstick = Qstick(LengthQ)
pos = iff(posReversal123 == 1 and posQstick == 1 , 1,
	   iff(posReversal123 == -1 and posQstick == -1, -1, 0))
possig = iff(reverse and pos == 1, -1,
          iff(reverse and pos == -1 , 1, pos))
if (possig == 1 )
    strategy.entry("Long", strategy.long)
if (possig == -1 )
    strategy.entry("Short", strategy.short)
if (possig == 0)
    strategy.close_all()
barcolor(possig == -1 ? #b50404: possig == 1 ? #079605 : #0536b3 )