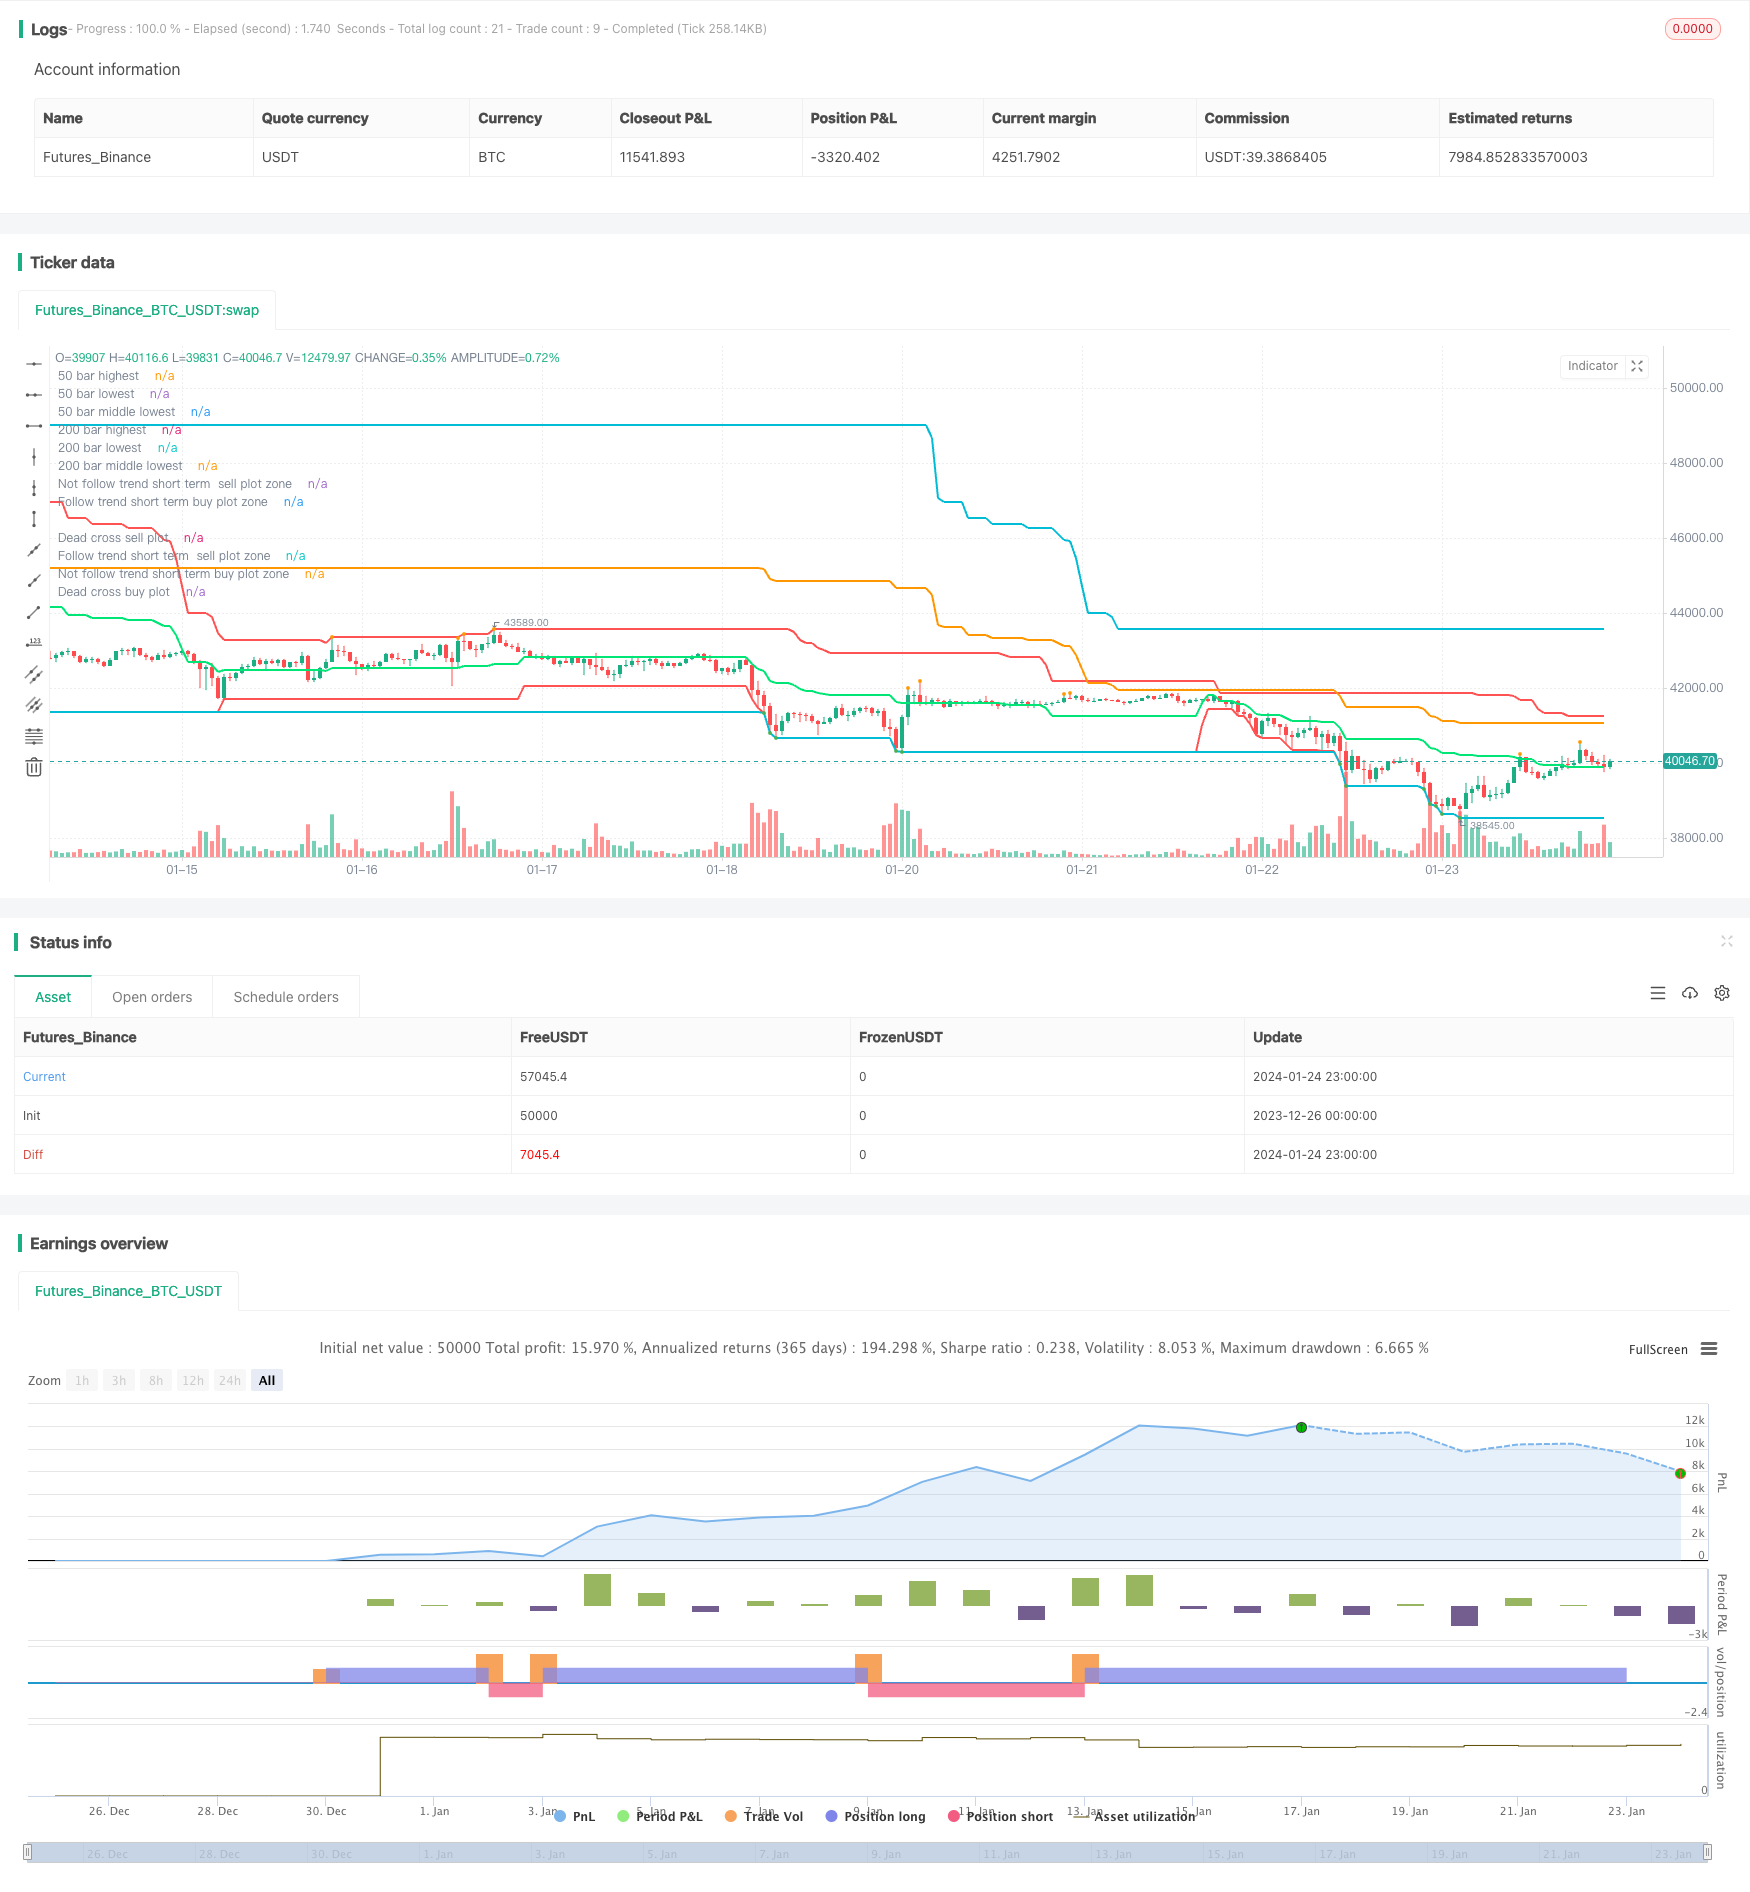
概述
该策略通过计算不同时间周期(50个bar和200个bar)内的最高价和最低价,形成主要的价格通道,代表长期趋势方向。同时结合快速信号线和慢速信号线判断短期趋势方向。策略会在长短期趋势方向一致时提示入场。
策略原理
首先,通过计算最后50个bar内的最高价、最低价,以及最后200个bar内的最高价、最低价,形成两个价格通道代表长期趋势方向。
其次,计算最后7个bar的最高价、最低价形成快速信号通道判断短期趋势;计算最后20个bar内的最高价、最低价形成慢速信号通道判断较短期的趋势。
最后,当快速信号通道、慢速信号通道以及长期价格通道的方向一致时提示入场信号。例如所有通道均处于上升趋势,则提示买入;所有通道均处于下降趋势,则提示卖出。
优势分析
该策略最大的优势在于能够识别长短期统一的趋势方向。通过不同时间周期价格通道的确认,可以有效避免被短期市场噪音所迷惑。
另外,策略采用多时间框架判断,即使短期价格出现反转也不会轻易改变信号,保证了信号稳定性。
风险分析
该策略主要风险在于长短期趋势反转时,由于需要多个时间周期通道确认,信号产生会有一定滞后。这时如果盲目跟进可能造成损失扩大。
此外,对高频交易不友好,无法对短期价格波动做出快速反应。如果遇到剧烈行情,停损条件设定不当也会造成较大亏损。
优化方向
可以考虑加入自适应动态止损策略,当价格向不利方向突破某个比例时止损出场,可有效控制风险。
另外可以增加更多不同长度的价格通道,通过投票方式决定最终信号,可提高判断准确率。
或者采用机器学习算法自动优化各通道参数,使得参数更加符合当前市场环境。
总结
该策略整体思路清晰易懂,通过多时间框架价格通道判断市场趋势,可有效滤除短期市场噪音。但对反转行情的处理及风险控制都有待加强。若结合止损策略及参数优化,可以进一步增强策略稳定性和实战效果。
策略源码
/*backtest
start: 2023-12-26 00:00:00
end: 2024-01-25 00:00:00
period: 1h
basePeriod: 15m
exchanges: [{"eid":"Futures_Binance","currency":"BTC_USDT"}]
*/

// This source code is subject to the terms of the Mozilla Public License 2.0 at https://mozilla.org/MPL/2.0/
// © ZoomerXeus

//@version=4
strategy("Swing High Low Price Channel V.1", overlay=true)

//========================= variable =================================//
dead_channel_source = input(title="Main swing channel source", defval="H/L", options=["H/L"])
fast_signal_length = input(title="Fast Slow Length", type=input.integer, defval=7, maxval=49, minval=1)
slow_signal_length = input(title="Slow Slow Length", type=input.integer, defval=20, maxval=49, minval=1)
is_show_only_dead_channel = input(title="Show main channel only", defval=true)
main_channel_width = input(title="Main line width", defval=2, minval=1)
signal_channel_width = input(title="Signal line width", defval=1, minval=1)

//========================= indicator function =================================//
dead_cross_high_50 = highest(high, 50)
dead_cross_high_200 = highest(high, 200)
//========================================
dead_cross_low_50 = lowest(low, 50)
dead_cross_low_200 = lowest(low, 200)
//========================================
medain_dead_cross_50 = ((dead_cross_high_50-dead_cross_low_50)*0.5)+dead_cross_low_50
medain_dead_cross_200 = ((dead_cross_high_200-dead_cross_low_200)*0.5)+dead_cross_low_200


//========================================
fasthighest = highest(high, fast_signal_length)
fastlowest = lowest(low, fast_signal_length)
//========================================
slowhighest = highest(high, slow_signal_length)
slowlowest = lowest(low, slow_signal_length)
//========================================


//========================= plot =================================//
plot(dead_channel_source == "H/L" ? dead_cross_high_50 : na,title="50 bar highest", color=color.red, linewidth=main_channel_width)
plot(dead_channel_source == "H/L" ? dead_cross_high_200 : na,title="200 bar highest", color=color.aqua, linewidth=main_channel_width)
plot(dead_channel_source == "H/L" ? dead_cross_low_50 : na,title="50 bar lowest", color=color.red, linewidth=main_channel_width)
plot(dead_channel_source == "H/L" ? dead_cross_low_200 : na,title="200 bar lowest", color=color.aqua, linewidth=main_channel_width)
plot(dead_channel_source == "H/L" ? medain_dead_cross_200 : na,title="200 bar middle lowest", color=color.orange, linewidth=main_channel_width)
plot(dead_channel_source == "H/L" ? medain_dead_cross_50 : na,title="50 bar middle lowest", color=color.lime, linewidth=main_channel_width)
//===========================================
plot(is_show_only_dead_channel == false ? fasthighest : na,title="fast signal highest", color=#ff00f9, linewidth=signal_channel_width)
plot(is_show_only_dead_channel == false ? fastlowest : na,title="fast signal lowest", color=#ff00f9, linewidth=signal_channel_width)
plot(is_show_only_dead_channel == false ? slowhighest : na,title="slow signal highest", color=color.white, linewidth=signal_channel_width)
plot(is_show_only_dead_channel == false ? slowlowest : na,title="slow signal lowest", color=color.white, linewidth=signal_channel_width)
//===========================================
plot(crossover(medain_dead_cross_50, medain_dead_cross_200) ? medain_dead_cross_200 : na, title="Dead cross buy plot", style=plot.style_circles, linewidth=6, color=color.lime)
plot(crossunder(medain_dead_cross_50, medain_dead_cross_200) ? medain_dead_cross_200 : na, title="Dead cross sell plot", style=plot.style_circles, linewidth=6, color=color.red)
plot(is_show_only_dead_channel and (medain_dead_cross_50 < medain_dead_cross_200) and high == slowhighest ? high : na, title="Follow trend short term  sell plot zone", style=plot.style_circles, linewidth=3, color=color.orange)
plot(is_show_only_dead_channel and (medain_dead_cross_50 > medain_dead_cross_200) and low == slowlowest ? low : na, title="Follow trend short term buy plot zone", style=plot.style_circles, linewidth=3, color=color.green)
plot(is_show_only_dead_channel and high == slowhighest and (high == dead_cross_high_200) ? high : na, title="Not follow trend short term  sell plot zone", style=plot.style_circles, linewidth=3, color=color.orange)
plot(is_show_only_dead_channel and low == slowlowest and (low == dead_cross_low_200) ? low : na, title="Not follow trend short term buy plot zone", style=plot.style_circles, linewidth=3, color=color.green)

//===================== open close order condition =========================================================//
strategy.entry("strong buy", true, 1, when=low == dead_cross_low_200)
strategy.exit("close strong buy 50%", "strong buy", qty_percent=50, when=high==slowhighest)
strategy.entry("strong sell", false, 1, when=high == dead_cross_high_200)
strategy.exit("close strong sell 50%", "strong sell", qty_percent=50, when=low==slowlowest)