概述
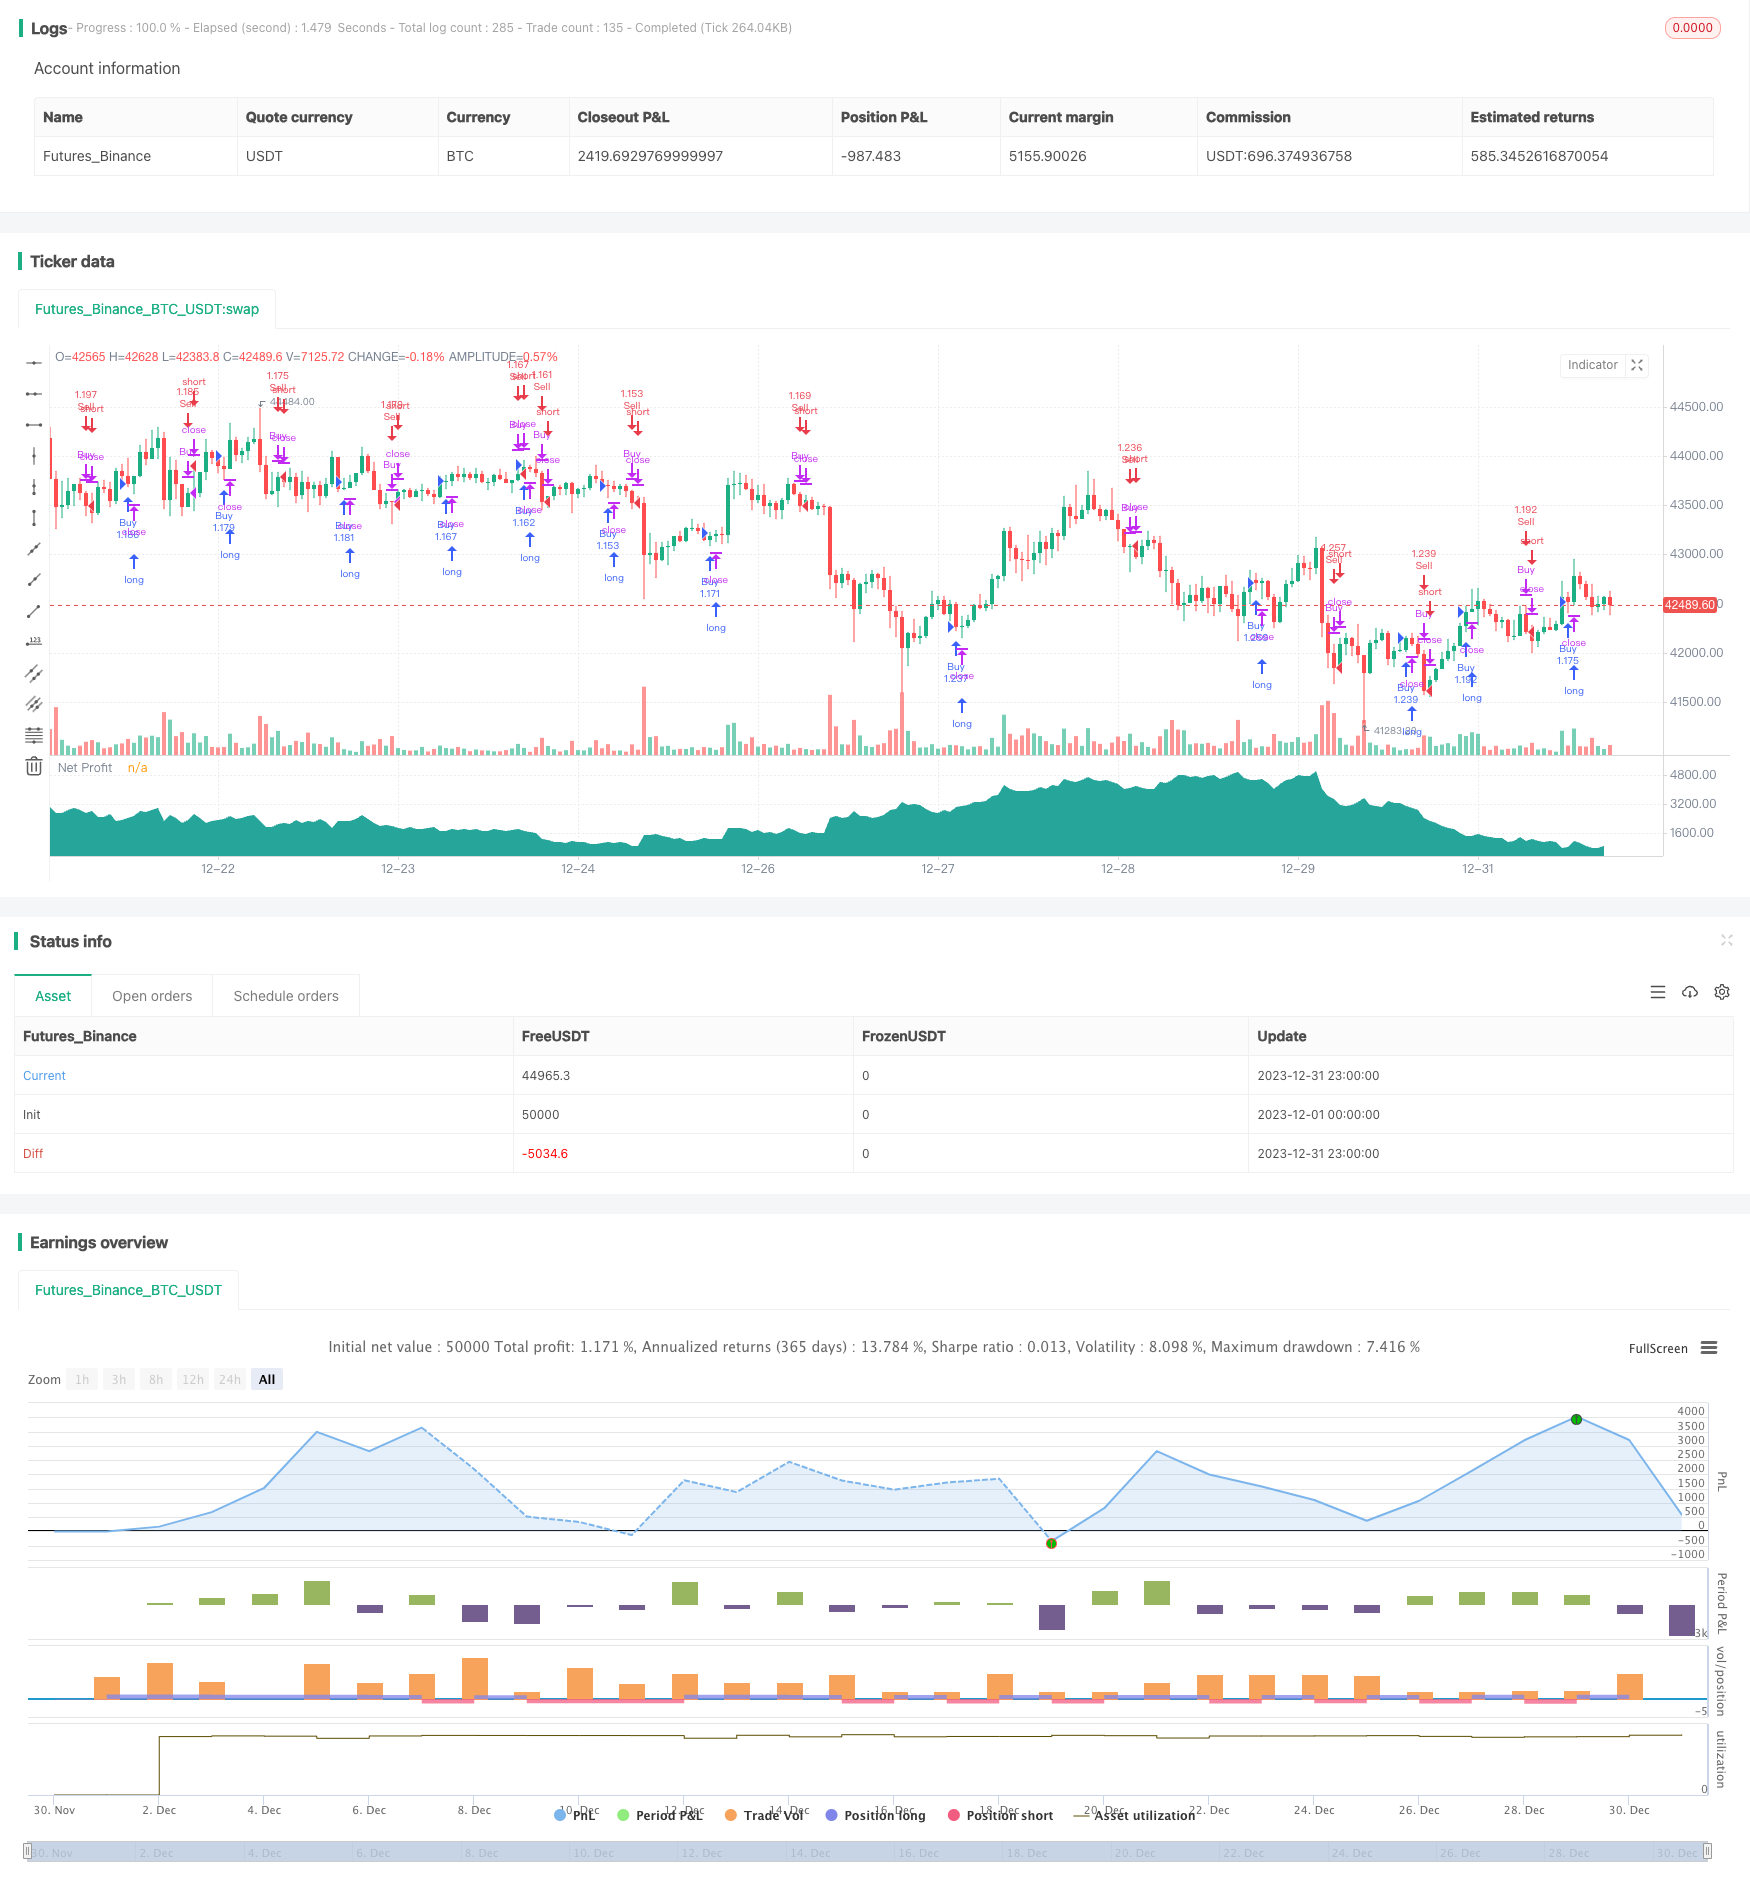
该策略基于简单移动平均线的金叉死叉原理,通过7日均线和14日均线的交叉进行买卖决策。 当7日均线从下方向上突破14日均线时发出买入信号;当7日均线从上方向下跌破14日均线时发出卖出信号。该策略同时设有止损、止盈和跟踪止损功能以锁定利润和控制风险。
策略原理
该策略的交易核心逻辑基于7日均线和14日均线的交叉原理。7日均线反应价格的短期趋势,14日均线反应价格的中期趋势。当短期均线从下方向上突破中期均线时,表明短期趋势变得更为强势,这是建立多头仓位的良好时机;相反,当短期均线从上方向下突破中期均线时,表明短期趋势转弱,应当清仓或建立空头仓位。
具体来说,该策略通过SMA指标计算7日和14日的简单移动平均线。在每根K线形成后,比较当前7日线和14日线大小关系。如果7日线上穿14日线,则发出做多信号,进入长仓;如果7日线下穿14日线,则发出做空信号,进入短仓。
此外,策略还设置了止损、止盈和跟踪止损来锁定利润和控制风险。具体参数可以根据回测结果进行优化。
策略优势
该策略具有以下优势:
- 规则简单清晰,容易理解实现,适合新手学习;
- 均线交叉原理行之有效,胜率较高;
- 设有止损、止盈和跟踪止损,可以有效控制风险;
- 参数较少,方便测试和优化。
风险及对策
该策略也存在一些风险:
- 当趋势发生转折时,均线交叉信号会滞后,无法及时反应趋势转变,可能带来较大亏损;
- 严重的横盘市场中,均线交叉信号频繁,将产生更多假信号,影响策略效果。
为应对上述风险,可以考虑以下对策:
- 结合其他指标过滤均线交叉信号,例如MACD、KDJ等,避免在趋势转折点产生错误信号;
- 增大止损幅度,缩短持仓周期,以降低单笔亏损的影响;
- 根据不同市场情况优化均线参数,在横盘市场中适当加大均线周期,减少交叉信号的频繁。
优化方向
该策略可以从以下几个方向进行优化:
- 测试不同均线组合和参数,找出最优参数;
- 添加其他指标进行信号过滤,提高策略效果;
- 优化止损、止盈参数,降低回撤,提高收益率;
- 根据不同品种和交易时段进行参数微调。
总结
该策略整体来说非常适合初学者学习,原理简单,容易理解和实现。同时也具有较好的市场适应性,通过参数调整和优化空间较大,可望获得稳定收益。值得 Quantitative Trading 初学者用来入门和学习。
策略源码
/*backtest
start: 2023-12-01 00:00:00
end: 2023-12-31 23:59:59
period: 1h
basePeriod: 15m
exchanges: [{"eid":"Futures_Binance","currency":"BTC_USDT"}]
*/

//@version=4
// This source code is subject to the terms of the Mozilla Public License 2.0 at https://mozilla.org/MPL/2.0/
// © bensonsuntw

strategy("Strategy Template[Benson]", pyramiding=1, default_qty_type=strategy.percent_of_equity, default_qty_value=100)

backtest_year = input(2019, type=input.integer, title='backtest_year')
backtest_month = input(01, type=input.integer, title='backtest_month', minval=1, maxval=12)
backtest_day = input(01, type=input.integer, title='backtest_day', minval=1, maxval=31)
start_time = timestamp(backtest_year, backtest_month, backtest_day, 00, 00)
stop_loss_and_tp = input(title="Enable Stop Loss and Take Profit", type=input.bool, defval=true)
trail_stop = input(title="Enable Trail Stop", type=input.bool, defval=true)
buy_stop_loss = input(0.2, type=input.float, title='buy_stop_loss')
sell_stop_loss = input(0.1, type=input.float, title='sell_stop_loss')
buy_tp = input(0.4, type=input.float, title='buy_tp')
sell_tp =input(0.2, type=input.float, title='sell_tp')
trail_stop_long = input(1.1, type=input.float, title='trail_stop_long')
trail_stop_short = input(0.9, type=input.float, title='trail_stop_short')
trail_stop_long_offset = input(0.05, type=input.float, title='trail_stop_long_offset')
trail_stop_short_offset = input(0.05, type=input.float, title='trail_stop_short_offset')


// you can set your own logic here
shortCondition = crossunder(sma(close,7),sma(close,14))
longCondition = crossover(sma(close,7),sma(close,14))

strategy.entry("Buy", strategy.long, when=longCondition  )
strategy.close("Buy", when=shortCondition)
strategy.exit("Close Buy","Buy", limit= stop_loss_and_tp?strategy.position_avg_price * (1+buy_tp):na, stop = stop_loss_and_tp?strategy.position_avg_price * (1-buy_stop_loss):na,trail_price=trail_stop?strategy.position_avg_price *trail_stop_long:na,trail_offset=trail_stop?-strategy.position_avg_price *trail_stop_long_offset:na)

strategy.entry("Sell", strategy.short, when=shortCondition)
strategy.close("Sell", when=longCondition)
strategy.exit("Close Sell","Sell", limit= stop_loss_and_tp?strategy.position_avg_price * (1-sell_tp):na, stop = stop_loss_and_tp?strategy.position_avg_price * (1+sell_stop_loss):na,trail_price=trail_stop?strategy.position_avg_price *trail_stop_short:na,trail_offset=trail_stop?strategy.position_avg_price *trail_stop_short_offset:na)


net_profit = strategy.netprofit + strategy.openprofit

plot(net_profit, title="Net Profit", linewidth=2, style=plot.style_area, transp=50, color=net_profit >= 0 ? #26A69A : color.red)