概述
本策略名为“布林线和RSI的FNGU量化交易策略”,是一种专门用于FNGU这只股票的长仓策略。该策略主要利用布林线指标和RSI指标来识别股票的超买超卖情况,进而产生买入和卖出信号。
策略原理
本策略的核心逻辑基于布林线指标和RSI指标的组合使用。
首先,布林线包含三条线:中线、上线和下线。其中,中线为n日简单移动平均线,上线和下线分别为中线正负k倍的标准差。当价格接近或触及上线或下线时,代表股票进入超买或超卖状态。
本策略中,布林线中线期间长度为235天,参数k值为2。当价格低于布林下线或价格从下向上突破布林中线时产生买入信号;当价格高于布林上线时产生卖出信号。
其次,RSI指标反映了股票的超买超卖程度。RSI高于70表示超买,低于30表示超卖。本策略中,RSI参数期间长度为2。
在本策略中,结合使用布林线指标和RSI指标:当RSI指标从超卖区突破并且同时价格低于或触及布林下线时产生买入信号;当RSI指标从超买区下破并且价格高于布林上线时产生卖出信号。
策略优势
本策略有以下几个优势:
结合布林线和RSI两个指标,使买卖信号更加准确可靠。
利用布林线识别股票的超买超卖区域,RSI过滤假信号,两者互相补充。
只进行长仓交易,无需考虑空头交易的风险。
策略参数经过优化,适合FNGU这只高波动股票。
实现了自动止损,降低亏损风险。
编程实现简单清晰,易于理解和修改。
风险及解决方法
本策略也存在一些风险,主要包括:
布林线和RSI都可能产生假信号,容易被套利,需要谨慎交易。可适当调整参数,或增加其他指标进行过滤。
FNGU股票本身波动性大,止损设置不当可能增加损失。应适当宽松止损幅度。
策略仅适合FNGU这类高波动股票,不适合其他股票,需要根据不同股票调整参数。
策略参数经过优化,但市场变化可能导致参数不再适用,需要持续关注优化。
策略优化方向
本策略还可从以下几个方向进行优化:
增加其他指标组合,如KDJ、MACD等,使信号更加准确。
优化布林线和RSI的参数,适应更多类型的股票。
增加机器学习模型辅助决策,利用更多数据产生交易信号。
实现跨周期交易,利用更高时间维度的数据产生信号。
结合情绪面分析,利用社交数据等产生交易信号。
开发量化回测系统,快速测试不同的参数设置。
总结
本策略是一种长仓策略,特别适用于波动较大的股票,如FNGU。它结合使用布林线指标和RSI指标,在超买超卖情况发生时产生交易信号,旨在捕捉股票价格的反转机会。该策略优化空间还很大,值得进一步研究改进,使其适用面更广,效果更好。
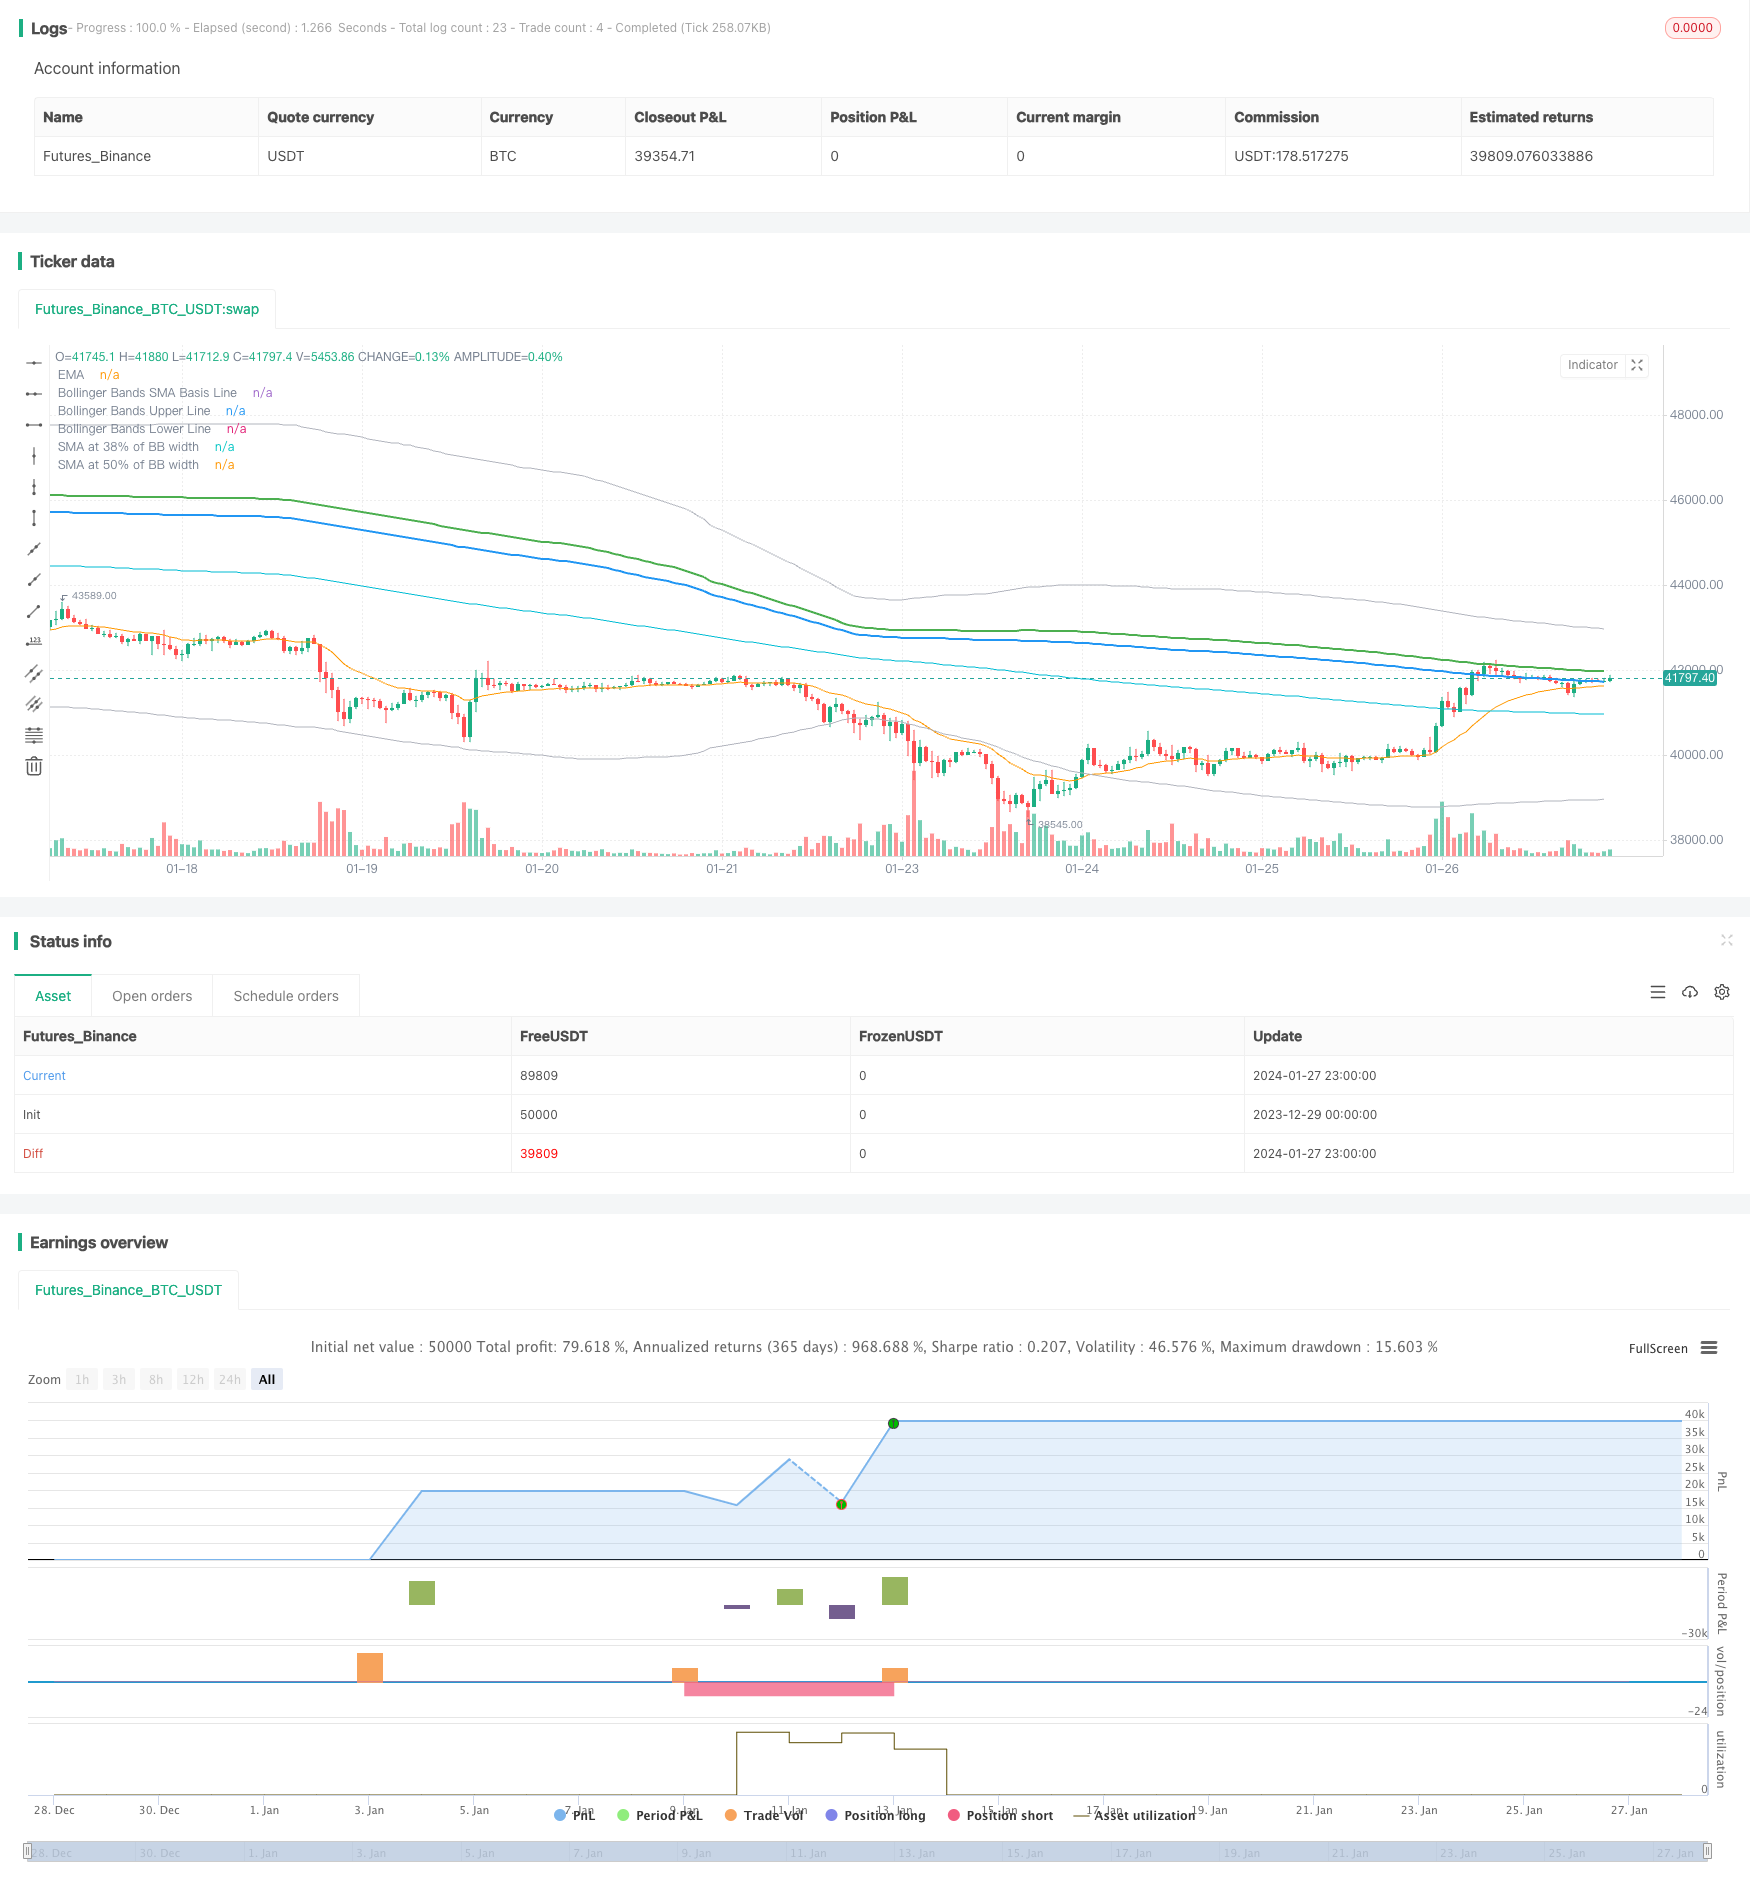
/*backtest
start: 2023-12-29 00:00:00
end: 2024-01-28 00:00:00
period: 1h
basePeriod: 15m
exchanges: [{"eid":"Futures_Binance","currency":"BTC_USDT"}]
*/

//@version=4
strategy("Bollinger + RSI + EMA, Double Strategy Long-Only (by EMKM)", shorttitle="1Min Killer", overlay=true)

///////////// RSI
RSIlength = input(2, title="RSI Period Length") // Adjusted RSI period length
RSIoverSold = 50
RSIoverBought = 50
price = close
vrsi = rsi(price, RSIlength)

///////////// Bollinger Bands
BBlength = input(235, minval=1, title="Bollinger Period Length") // Adjusted Bollinger period length
BBmult = 2
BBbasis = sma(price, BBlength)
BBdev = BBmult * stdev(price, BBlength)
BBupper = BBbasis + BBdev
BBlower = BBbasis - BBdev
BBtarget38 = BBbasis + 0.38 * BBdev  // Line at 38% of Bollinger Band width
BBtarget50 = BBbasis + 0.50 * BBdev  // Line at 50% of Bollinger Band width

///////////// EMA
emaLength = input(20, title="EMA Period Length")
ema = ema(close, emaLength)

source = close
buyEntry = crossover(source, BBlower) or (close < BBlower and close > BBbasis) or (low < BBlower and close > BBbasis) // Add condition for low touching Bollinger Band
sellEntry = crossunder(source, BBupper)

///////////// Plotting
plot(BBbasis, color=color.aqua, title="Bollinger Bands SMA Basis Line")
plot(BBupper, color=color.silver, title="Bollinger Bands Upper Line")
plot(BBlower, color=color.silver, title="Bollinger Bands Lower Line")
plot(BBtarget38, color=color.blue, linewidth=2, title="SMA at 38% of BB width")  // Line at 38%
plot(BBtarget50, color=color.green, linewidth=2, title="SMA at 50% of BB width")  // Line at 50%
plot(ema, color=color.orange, title="EMA")  // Plot EMA

///////////// RSI + Bollinger Bands Strategy
longCondition = crossover(vrsi, RSIoverSold) and buyEntry
sellCondition = crossunder(vrsi, RSIoverBought) and close > BBupper

close_long = close > BBbasis
close_short = close < BBbasis

if (not na(vrsi))
    if longCondition
        strategy.entry("Buy", strategy.long, qty=10, stop=BBlower, comment="Buy")
    else
        strategy.cancel(id="Buy")

    if close_long
        strategy.close("Buy")

if (sellCondition)
    strategy.entry("Sell", strategy.short, qty=10, stop=BBupper, comment="Sell")
else
    strategy.cancel(id="Sell")

if close_short
    strategy.close("Sell")