概述
该策略基于移动均线的金叉死叉原理制定交易信号。它融合了短期、中期和长期三条不同参数设置的移动均线,通过比较这三条均线的高低关系判断市场的多空状态,产生交易信号。
策略原理
该策略设置了3条移动平均线,分别是一段短期的简单移动平均线、一段中期的权重移动平均线和一段长期的指数移动平均线。具体来说,分别设置了长度为1的SMA线、长度为20的WMA线和长度为25的EMA线。
当短期SMA线上穿中期WMA线而收盘价又高于WMA线时,说明市场由下向上反转,形成多头信号;当短期SMA线下穿中期WMA线或收盘价低于WMA线时,则为空头信号。所以,该策略通过比较三条均线的高低和交叉情况判断市场的多空状态。
优势分析
该策略结合短、中、长三条不同均线,能对不同周期的市场变化做出反应,提高捕捉趋势的准确性。特别是中期的WMA具有更好的去噪波动的效果,可以有效过滤错信号。另外,该策略仅在SMA和收盘价的多头信号达成高度一致性时才发出建仓信号,这避免了whipsaws,确保每次入场的效率。
风险分析
该策略可能存在误报风险。当短期SMA产生误差信号时,由于该策略严格依赖SMA线的信号,可能导致不必要的亏损。此外,该策略对参数比较敏感,当市场进入震荡区间而参数设置不当时,会产生大量的错误交易。
为防范这些风险,建议调整均线的长度,适当放宽交易条件,并设置止损来控制单笔损失。当市场趋势不明显时,也可以暂时停止策略交易。
优化方向
该策略可以从以下几个方面进行优化:
增加更多类型的均线指标,如KC线等,形成指标集合,提高判断准确性
增加成交量的因素,如放量突破
结合波动率指标,避免震荡行情的失效
采用机器学习等手段对参数进行训练和优化
总结
该策略根据三条均线的交叉和收盘价的实时关系判断市场多空状态,简单可靠。它结合了不同长度区间的均线,能有效发现趋势,信号质量较高。通过适当调整参数及引入更多辅助指标,该策略可以进一步增强针对性和稳定性。
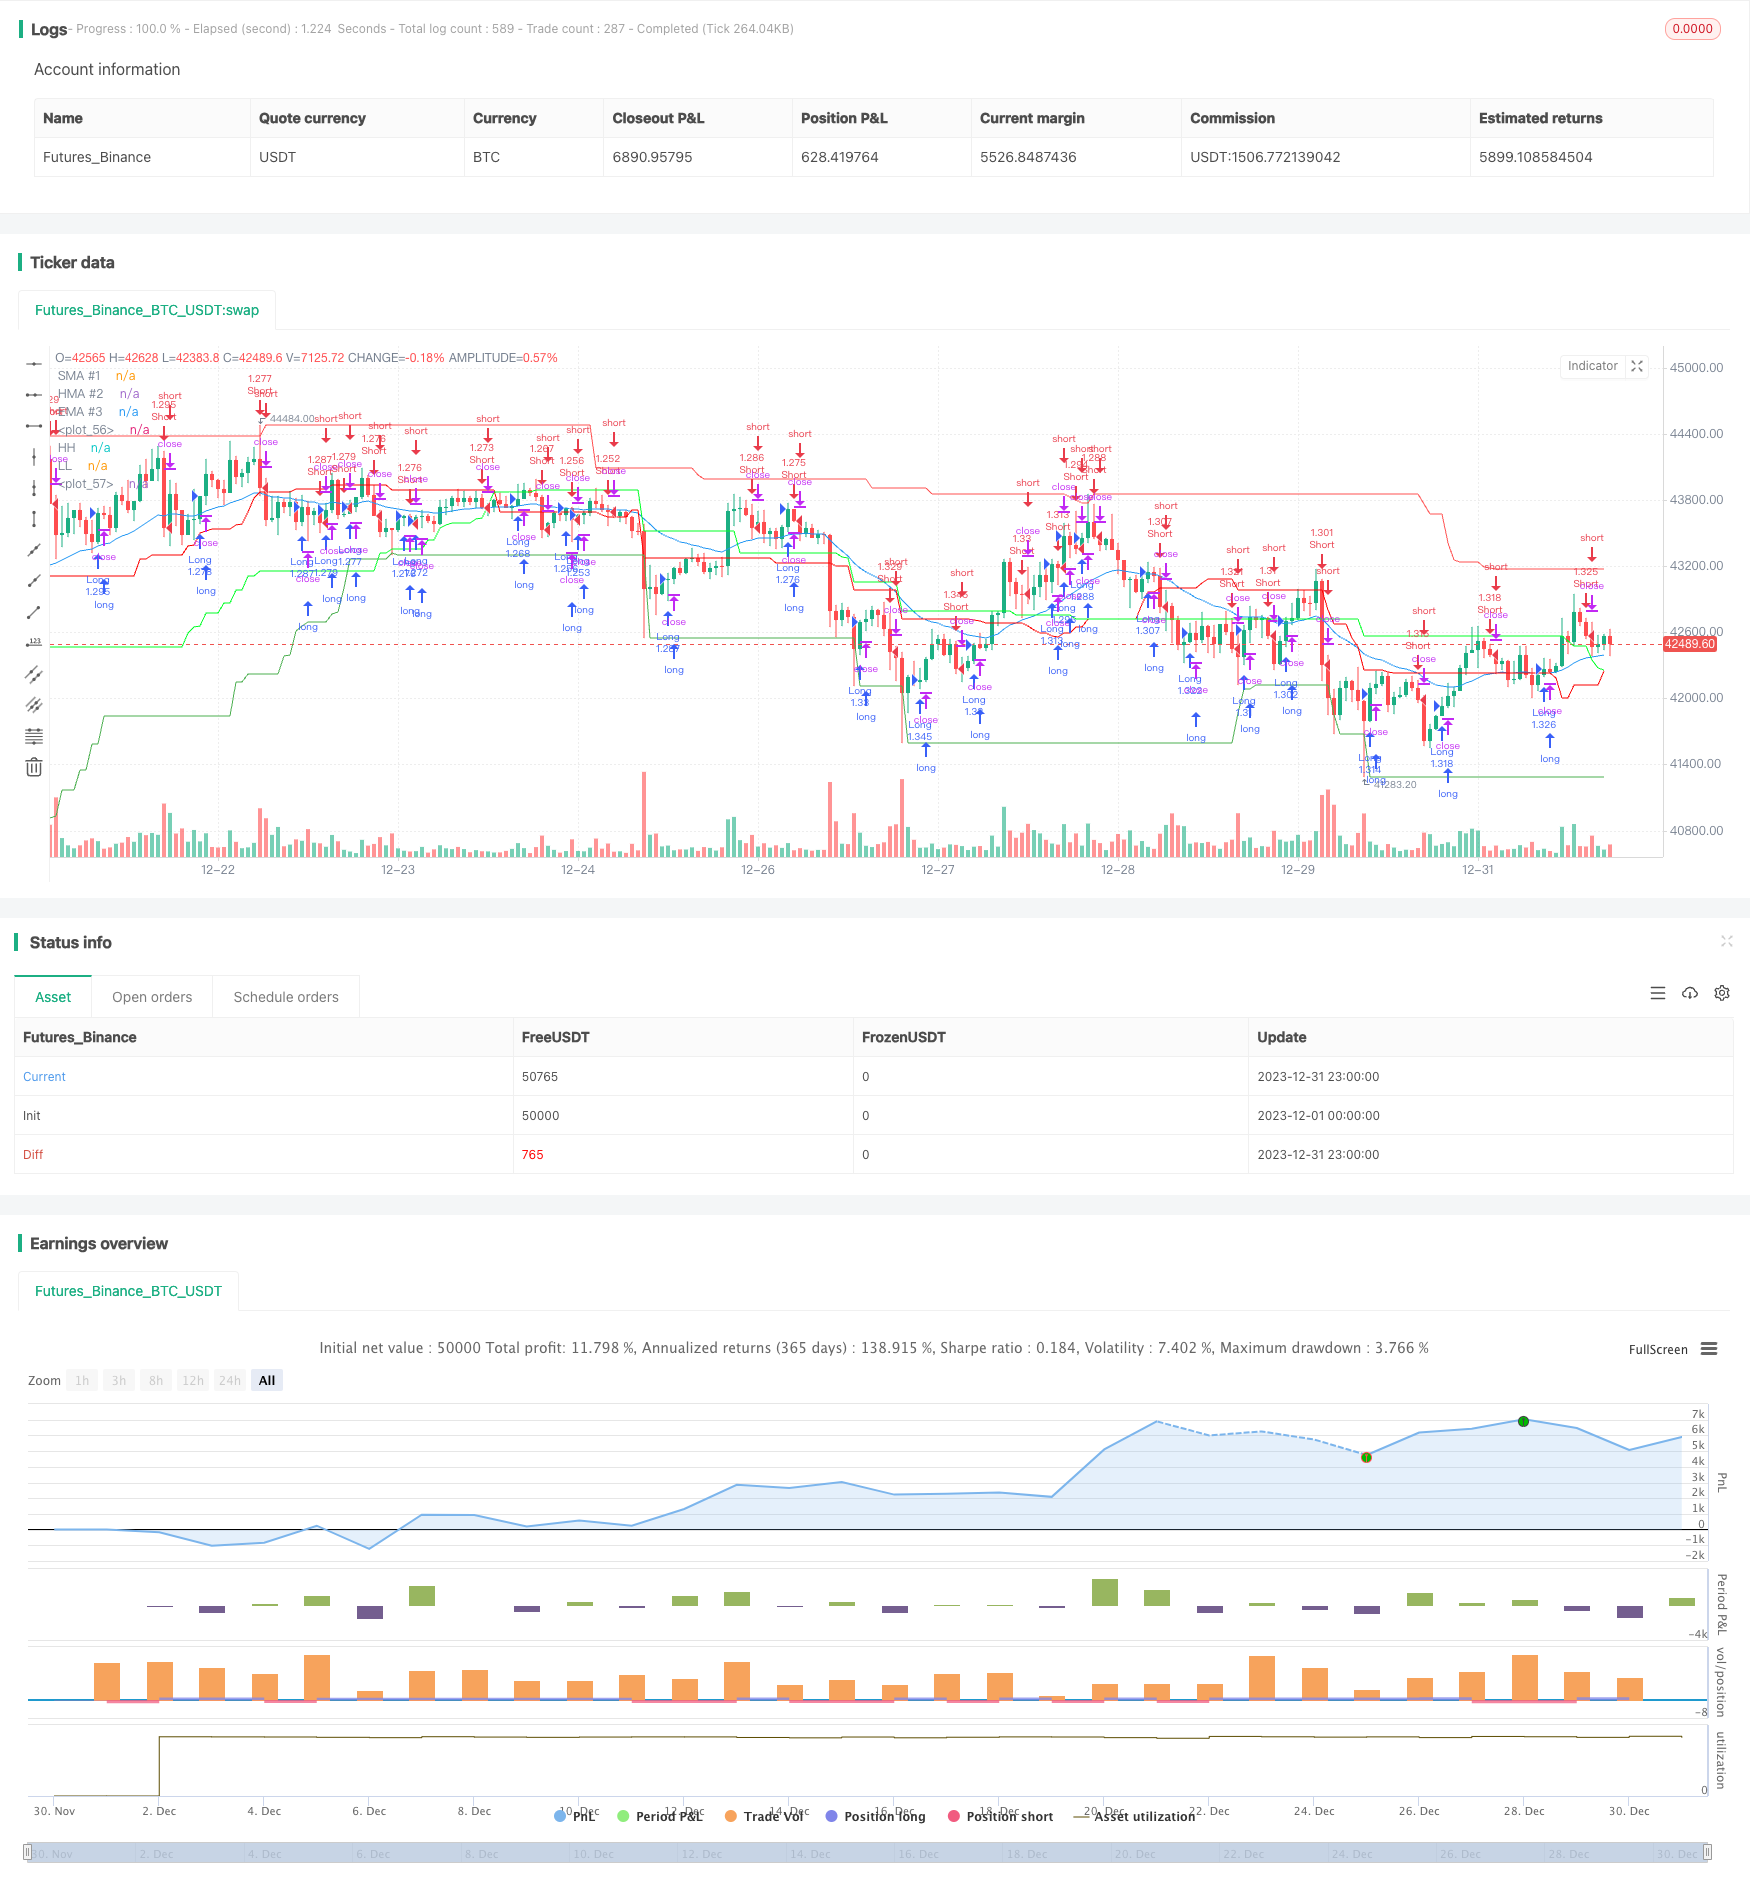
/*backtest
start: 2023-12-01 00:00:00
end: 2023-12-31 23:59:59
period: 1h
basePeriod: 15m
exchanges: [{"eid":"Futures_Binance","currency":"BTC_USDT"}]
*/

//@version=5
strategy("EMA Candle Close Strategy KHANH 11/11/2023", overlay=true, initial_capital=100, commission_type=strategy.commission.percent, commission_value=0.0000005, default_qty_type=strategy.percent_of_equity, default_qty_value=100)

len1 = input.int(1, title="SMA #1 Length", minval=1)
src1 = input(close, title="SMA Source #1")
out1 = ta.sma(src1, len1)
plot(out1, title="SMA #1", color=close >= out1 ? color.rgb(120, 123, 134, 100) : color.rgb(120, 123, 134, 100), linewidth=1)

len2 = input.int(20, title="HMA #2 Length", minval=1)
src2 = input(close, title="HMA Source #2")
out2 = ta.hma(src2, len2)
plot(out2, title="HMA #2", color=close >= out2 ? color.rgb(253, 255, 254, 100) : color.rgb(255, 255, 255, 100), linewidth=1)

len3 = input.int(25, title="EMA #3 Length", minval=1)
src3 = input(close, title="EMA Source #3")
out3 = ta.ema(src3, len3)
plot(out3, title="EMA #3", color=close >= out3 ? color.blue : color.blue, linewidth=1)

// Define the long condition
longCondition = (out1 > out2 and close > out2)

// Define the short condition
shortCondition = (out1 < out2 or close < out2)

// Entry conditions
if (longCondition)
    strategy.entry("Long",strategy.long)
else if (shortCondition)
    strategy.entry("Short", strategy.short)

// Trade channel plot
PeriodLookBack = input(55, title="Period Look Back")
xHighest55 = request.security(syminfo.tickerid, timeframe.period, ta.highest(PeriodLookBack))
xLowest55 = request.security(syminfo.tickerid, timeframe.period, ta.lowest(PeriodLookBack))
plot(xHighest55[1], color=color.red, title="HH")
plot(xLowest55[1], color=color.green, title="LL")


//@version=5
//indicator("Custom Moving Averages", shorttitle="CMA", overlay=true)

shortLength = input(defval=40, title="Short Length")
longLength = input(defval=80, title="Long Length")

// Sử dụng khung thời gian của biểu đồ đang sử dụng thay vì cố định là "D"
shortTopBorder = request.security(syminfo.tickerid, timeframe.period, ta.highest(high, shortLength))
shortBottomBorder = request.security(syminfo.tickerid, timeframe.period, ta.lowest(low, shortLength))

longTopBorder = request.security(syminfo.tickerid, timeframe.period, ta.highest(high, longLength))
longBottomBorder = request.security(syminfo.tickerid, timeframe.period, ta.lowest(low, longLength))

shortAverageLine = (shortTopBorder + shortBottomBorder) / 2
longAverageLine = (longTopBorder + longBottomBorder) / 2

plot(shortAverageLine, color=color.new(#fc0000, 0))
plot(longAverageLine, color=color.new(#01ff27, 0))