概述
本策略综合考虑市场流通性、趋势和技术指标等多个维度,实现短线策略交易。该策略可以跟随趋势,利用市场流动性较好的时候进行开仓操作,从而获得短线利润。
策略原理
基本原理:本策略主要考虑市场流动性和趋势两个维度。在市场流动性较好,且出现趋势的时候进行短线操作。
市场流动性指标:本策略主要使用MFI和交易量变化作为市场流动性指标。当MFI上涨且交易量上涨时,我们认为市场流动性较好,适合开仓。
趋势判断:本策略结合ADX,EMA等多个指标判断趋势。当ADX高于30和其EMA时表示趋势较强。同时,如果快慢EMA发生黄金交叉等情况,也可以验证趋势。
开仓条件:市场流动性较好,且同时出现趋势的时候,如果其他辅助条件(如SAR位置判断等)也符合,则产生开仓信号。
止盈止损设置:本策略针对每个交易设置了固定止盈(10个点)和止损(7.5个点)。
优势分析
本策略具有以下优势:
利用市场流动性判断时机:基于MFI和交易量判断市场流动性,避免在市场流动性差的时候开仓。
跟踪趋势获得利润:结合EMA等指标判断趋势方向,助力获得趋势利润。
风险控制到位:设置了固定止盈止损,有效控制单次交易最大损失。
交易频率较高:作为一个短线策略,交易频率会比较高,适合逐步积累利润。
参数优化空间较大:例如MA参数、止损止盈设置等都可以进行优化,提高策略效果。
风险分析
本策略也存在一些风险:
实盘滑点控制风险:理论止损止盈并不能完全反映实盘情况,实盘中滑点可能比较大。
趋势判断失败风险:本策略对趋势判断依赖较多指标,但仍然存在失败的可能性。
过度交易风险:作为一个短线策略,如果参数设置不当可能导致过度交易。
市场异常情况风险:在市场流动性极差或者政策变化等极端情况下,本策略可能无法正常工作。
对应地,我们可以从以下几个方面来降低风险:
适当放宽止损范围,考虑实盘滑点因素。
优化趋势判断逻辑,引入更多指标,降低失败概率。
添加开仓频率限制,避免过度交易。
根据市场情况灵活调整参数,应对异常情况。
优化方向
本策略的优化方向包括:
引入更多指标优化趋势判断,使得判断更准确。例如引入MACD指标等。
优化MA的周期参数,寻找最佳参数组合。
改进止损止盈策略,例如采用移动止损、区间止损等方式。
对交易次数加入限制,避免过高频率交易。例如每天最多开仓3次。
寻找更好的市场流动性指标,进一步判断开仓时机。例如引入净流入量等指标。
添加参数优化功能,实现参数自动优化寻找最优参数组合。
总结
本策略综合考虑市场流动性和趋势等多个维度,在短线内捕捉利润。与传统趋势策略相比,本策略最大的创新在于引入市场流动性指标,避免在市场流动性差时断对开仓。对应地,本策略也存在一定实盘控制风险和趋势判断失败风险。我们可以通过引入更多指标、优化参数以及风险管理的方式不断完善本策略。
/*backtest
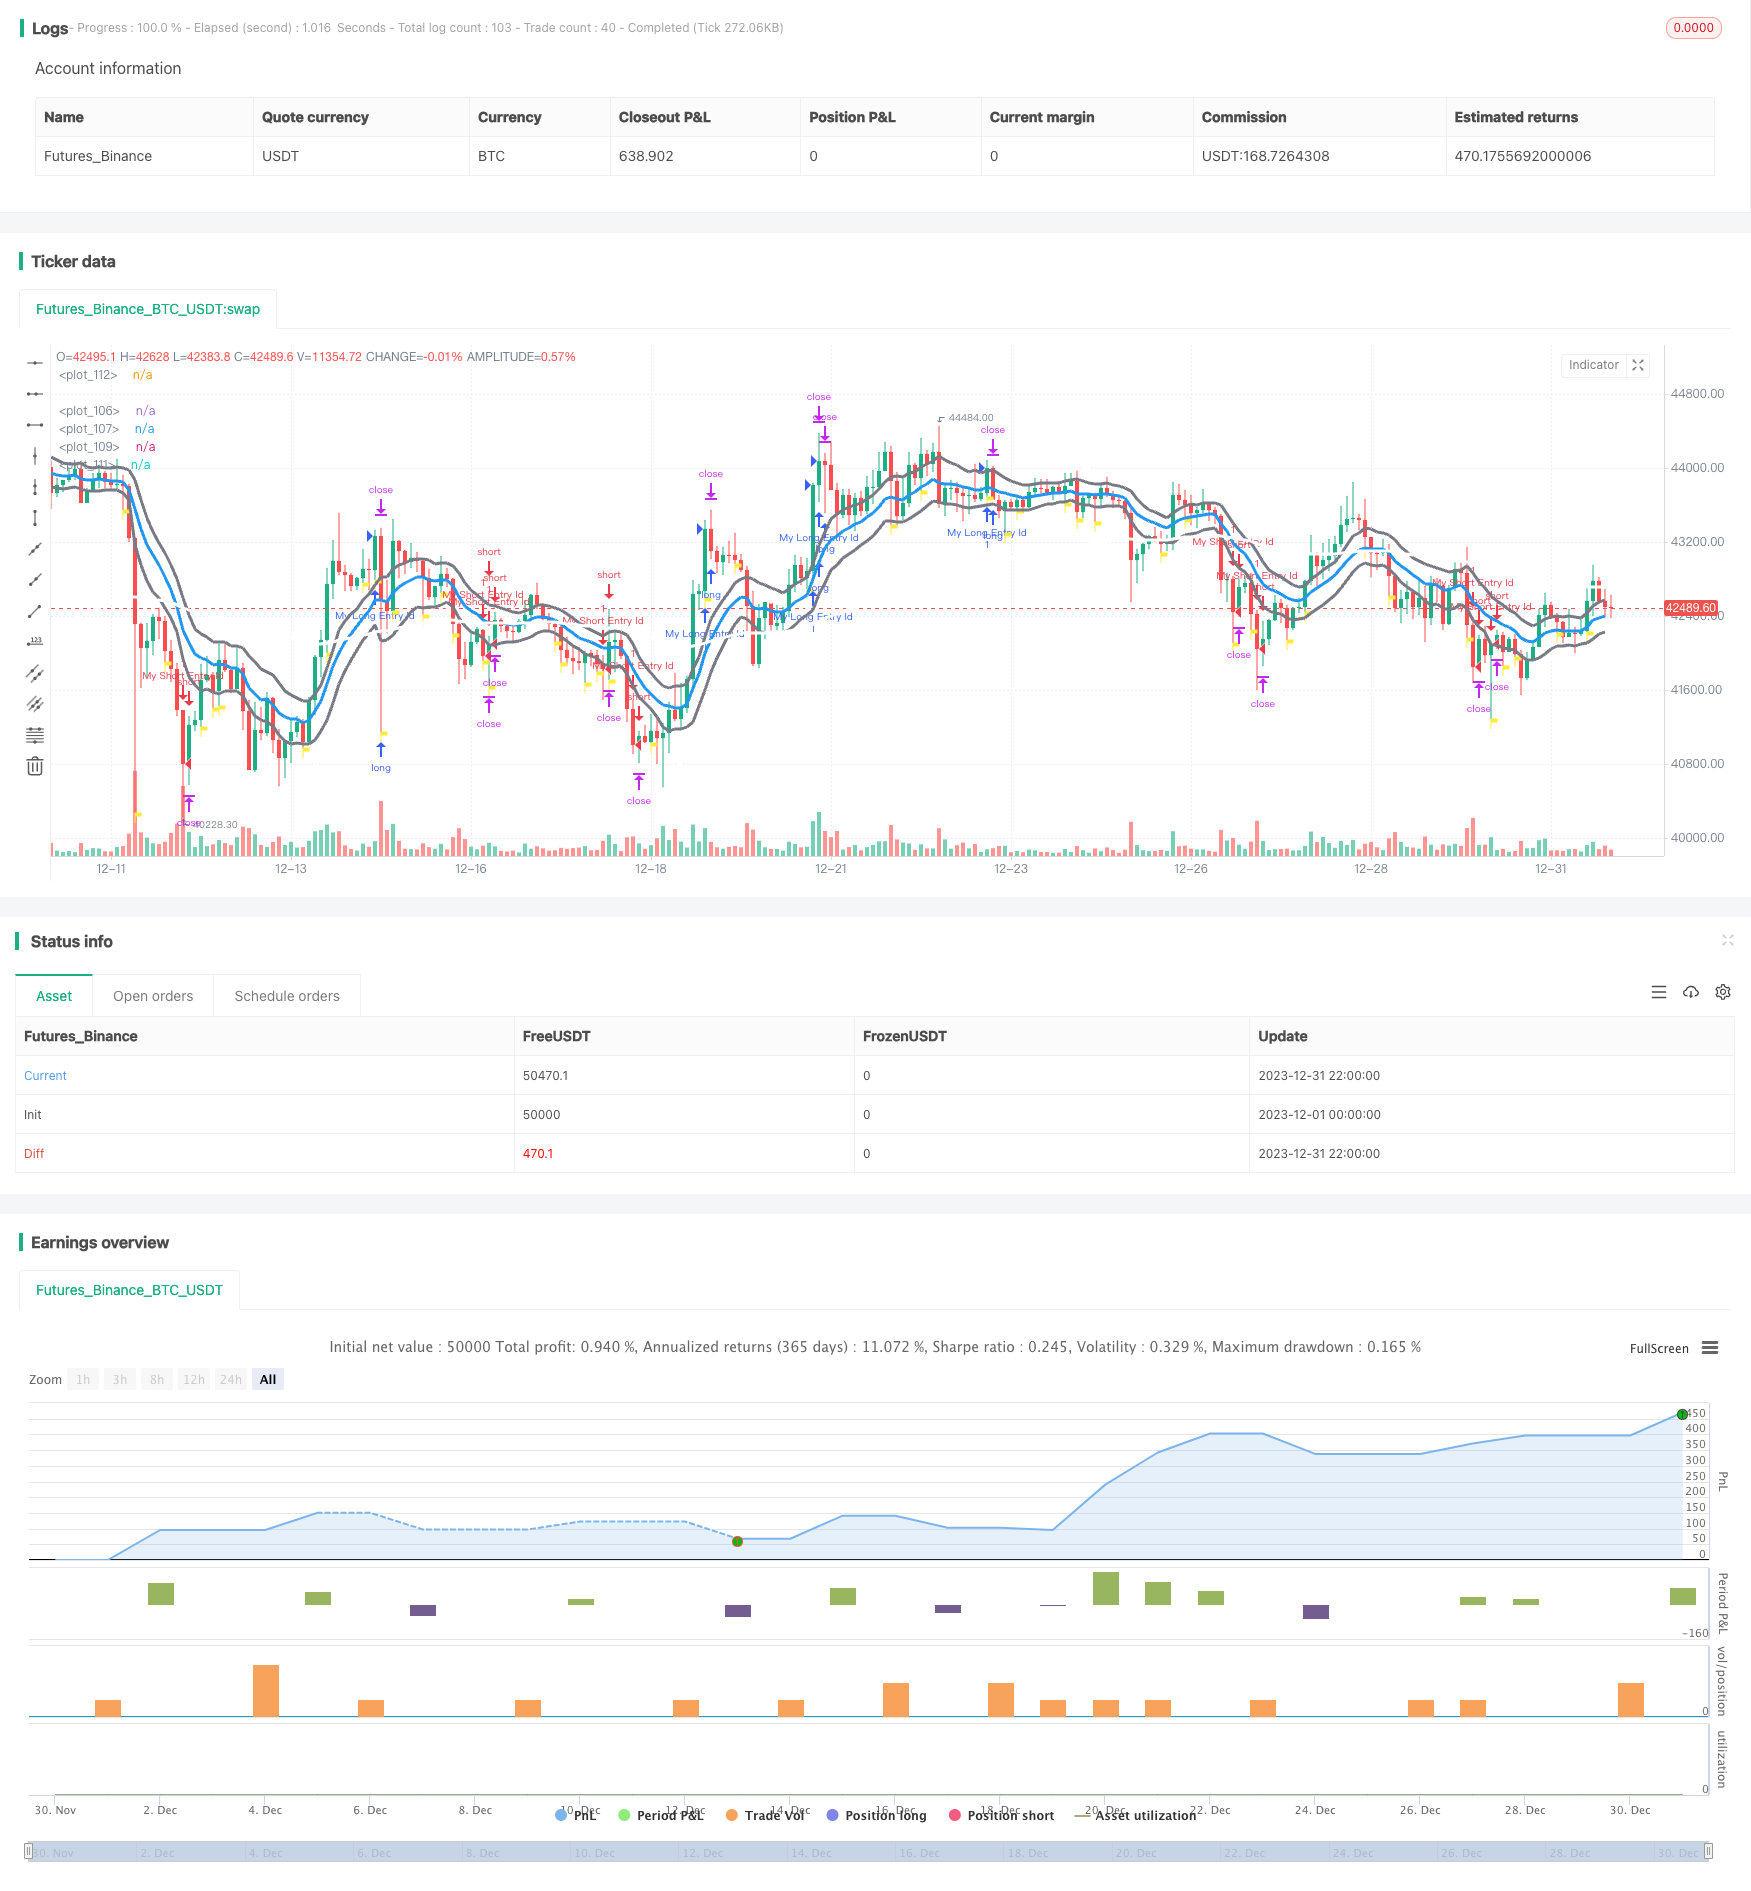
start: 2023-12-01 00:00:00
end: 2023-12-31 23:59:59
period: 2h
basePeriod: 15m
exchanges: [{"eid":"Futures_Binance","currency":"BTC_USDT"}]
*/
// This source code is subject to the terms of the Mozilla Public License 2.0 at https://mozilla.org/MPL/2.0/
// © trent777brown
//@version=5
strategy("scalping with market facilitation", overlay=true, margin_long=100, margin_short=100)
MFI0 = (high - low) / volume
MFI1 = (high[1] - low[1]) / volume[1]
MFIplus = MFI0 > MFI1
MFIminus = MFI0 < MFI1
//Current Trend-(Changed mean to trend)-revised
trendplus = hl2 > high[1]
trendzero = hl2 < high[1] and hl2 > low[1] //addition of script
trendminus = hl2 < low[1] //changed high to low
//Volume +/-
volplus = volume > volume[1]
volminus = volume < volume[1]
//Period Control by Buyers or Sellers is determined with reference to Price action of the period
//divided into 3 sectors, sector 1 is the Top third, Sector 2 is the middle third,
//and sector 3 is the Bottom third of the period. Control classifications are: Extremes(11, 33), Neutral(22),
//Climbers(31,21,32) Open lower than Close, and Drifters(13,23,12)Close lower than Open
//value0 = low
//value1 = ((high - low)/3)
//value2 = ((high - low)/3)*2
//value3 = high
//o1 = (open >= (((high - low)/3) * 2) + low)
//c1 = (close >= (((high - low)/3) * 2) + low)
//o2 = (open <= o1)
//c2 = (close <= c1)
//o3 = (open <= ((high - low)/3) + low)
//c3 = (close <= ((high - low)/3) + low)
//sector2 = if((high - low)/3) + low and sector2 <= (((high - low)/3)*2) + low
//sector3 = if((high - low)/3) + low and >= low
//Extremes-Full Control of Period by Buyers or Sellers
//pg79 notes an 85% chance that the current trend will change in the next 1 to 5 bars
b11 = open >= (high - low) / 3 * 2 + low and close >= (high - low) / 3 * 2 + low //Extreme Buyer Control:Chartruse
b33 = open <= (high - low) / 3 + low and close <= (high - low) / 3 + low //Extreme Seller Control:Crimson
//Neutral pg80
b22 = open >= (high - low) / 3 + low and open <= (high - low) / 3 * 2 and close >= (high - low) / 3 + low and open <= (high - low) / 3 * 2 //Bracketed Price Control
//Climber-Open lower than Close pg81
b31 = open <= (high - low) / 3 + low and close >= (high - low) / 3 * 2 + low //Strong Buyer Control:Dark Green
b21 = open >= (high - low) / 3 + low and open <= (high - low) / 3 * 2 and close >= (high - low) / 3 * 2 + low //Moderate Buyer Control:Green
b32 = open <= (high - low) / 3 + low and close >= (high - low) / 3 + low and open <= (high - low) / 3 * 2 //Weak Buyer Control:Light Green
//Drifter-Close lower than Open pg81
b13 = open >= (high - low) / 3 * 2 + low and close <= (high - low) / 3 + low //Strong Seller Control:Dark Red
b23 = open >= (high - low) / 3 + low and open <= (high - low) / 3 * 2 and close <= (high - low) / 3 + low //Moderate Seller Control:Red
b12 = open >= (high - low) / 3 * 2 + low and close >= (high - low) / 3 + low and open <= (high - low) / 3 * 2 //Weak Seller Control:Light Red/Pink
//
psar= ta.sar(.09, .2, .2)
ema8= ta.ema(hlc3, 8)
ema13h= ta.ema(high, 13)
ema13l= ta.ema(low, 13)
ema13= ta.ema(close, 13)
ema55= ta.ema(close, 100)
[dip, dim, adx]= ta.dmi(5, 5)
adxema=ta.ema(adx, 3)
[macdl, sigl, histl]= ta.macd(close, 8, 13, 5)
obv= ta.obv
obvema= ta.ema(obv, 8)
obvema55= ta.ema(obv, 55)
mfigreen= MFIplus and volplus
adx_x_over= ta.crossover(adx, adxema) and adx >= 25
barssincemfi= ta.barssince(mfigreen)
longtrig2= adx > 30 and adx > adxema and barssincemfi <= 4
shorttrig2= adx > 30 and adx > adxema and barssincemfi <= 4
long= macdl > sigl and obv > obvema55 and ema8 > ema55 and psar < low and trendplus//and ema13l > ema55//and open > hull200 and close > hull200
short= macdl < sigl and obv < obvema55 and ema8 < ema55 and psar > high and trendminus//and ema13h < ema55//open < hull200 and close < hull200
//plot(hull200, color=color.red, linewidth=3)
plot(ema13h, color=color.gray, linewidth=3)
plot(ema13l, color=color.gray, linewidth=3)
plot(ema13, color=color.blue, linewidth=3)
//
plot(ema55, color=color.white, linewidth=3)
plot(psar, color=color.white, style=plot.style_circles)
plotshape(mfigreen, color=color.yellow, style=shape.flag, location=location.belowbar, size= size.tiny)
longCondition = long
if (longCondition)
strategy.entry("My Long Entry Id", strategy.long, 1, when= longtrig2)
strategy.exit("exit long", "My Long Entry Id", profit= 100, loss= 75)
shortCondition = short
if (shortCondition)
strategy.entry("My Short Entry Id", strategy.short, 1, when= shorttrig2)
strategy.exit("exit short", "My Short Entry Id", profit= 100, loss= 75)