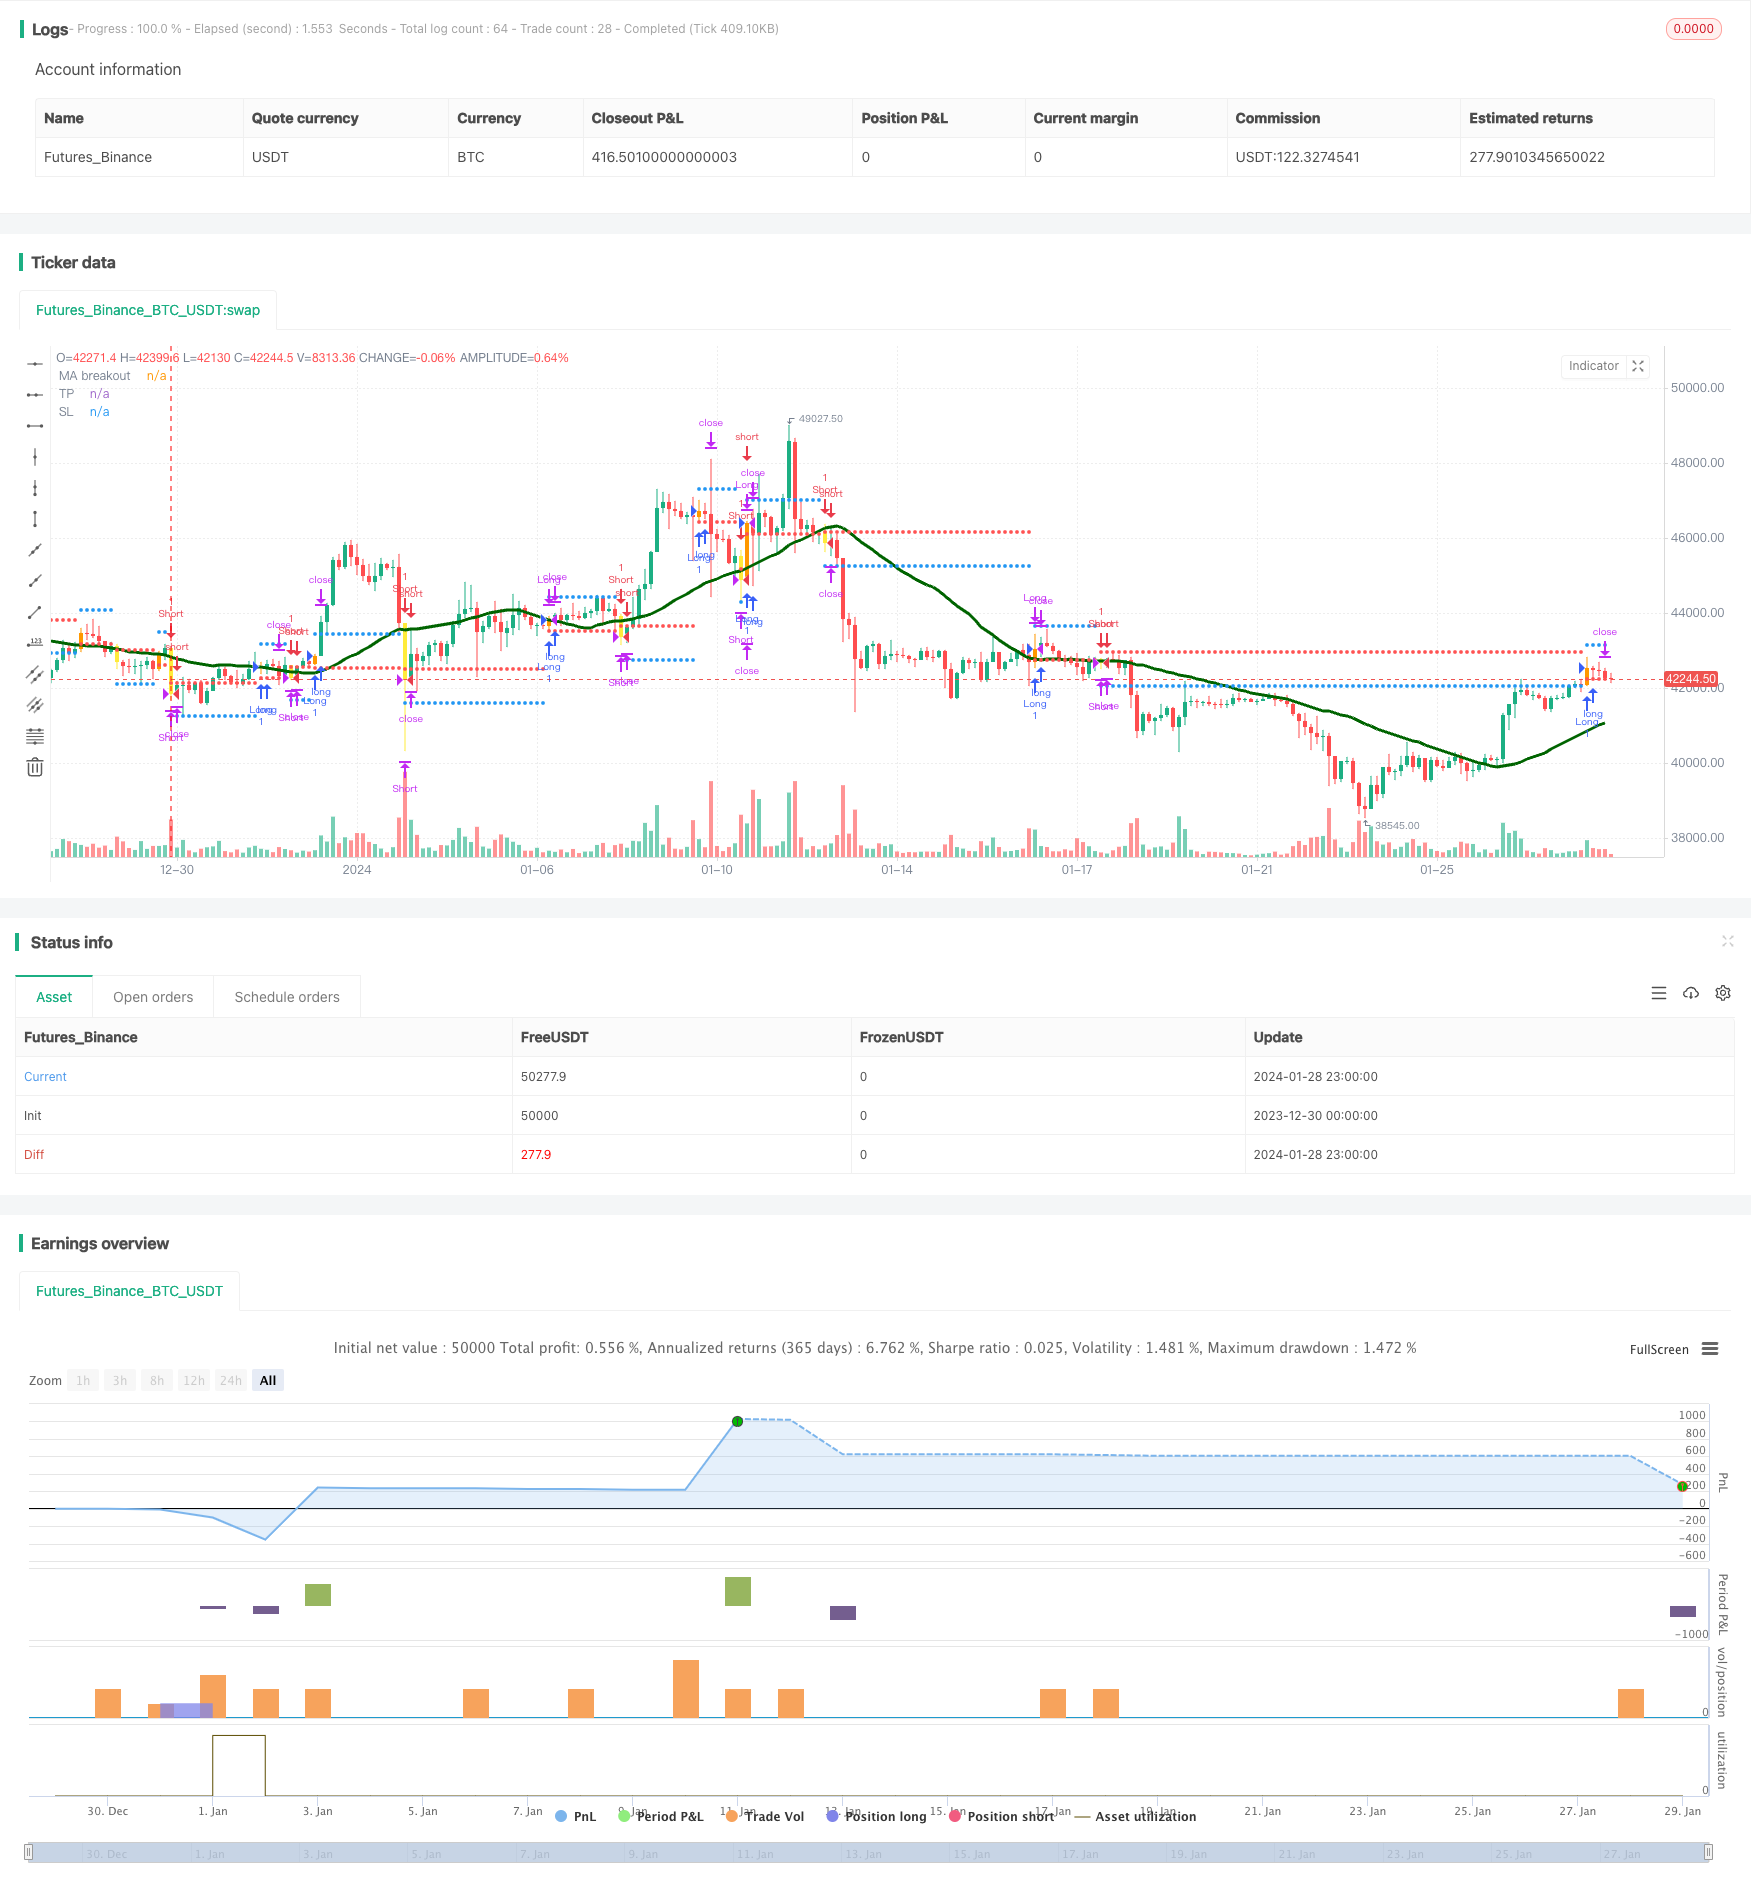
概述
本文介绍一种以吞噬模式识别获利机会和价格与移动平均线交叉做为入场信号的算法交易策略。该策略结合价格技术分析与趋势跟踪方法,旨在在盘整和趋势反转点位获利。
原理
该策略的核心逻辑基于两个非相关指标的融合:
吞噬形态:一种两根K线的反转模式,第二根K线的实体完全“吞噬”了第一根K线的实体,用以识别反转机会。
价格与移动平均线交叉:当价格从移动平均线下方突破向上交叉移动平均线时,产生买入信号;当价格从移动平均线上方突破向下交叉移动平均线时,产生卖出信号。
通过吞噬形态判断市场可能反转的时机,再结合价格与移动平均线的穿越作为确定反转的过滤信号,可以提高获利概率。
具体来说,该策略通过追踪三种吞噬形态:多头吞噬、空头吞噬和无影线吞噬,判断盘整和反转的可能。再结合价格与移动平均线的金叉和死叉信号过滤,最终决定开仓方向。
优势
该策略最大的优势是利用非相关指标的融合提高决策效果。吞噬形态判断市场反转时机和概率;而价格与移动平均线交叉验证反转方向和力度。两者相互验证,可以有效降低假信号导致的交易损失。
另一个优势是参数设置灵活。用户可以自行设定移动平均线周期、止损幅度等参数,对策略进行优化。
风险
尽管利用多种指标提高判断效果,该策略依然存在一定的假信号风险。吞噬形态并不是百分之百可靠的反转信号,价格与移动平均线的交叉也会有失效情况。这些都可能导致超前开仓亏损。
此外,像大多数技术分析策略一样,该策略对冲突行情如价格震荡盘整的市场效果也较差。持续震荡可能触发止损或缩短获利空间。
为控制风险,可以适当调整移动平均线参数,优化止损幅度。也可以考虑结合其他指标识别趋势和震荡行情,动态调整策略参与程度。
优化方向
该策略可以通过以下几个方面进行优化:
测试更多类型的移动平均线,寻找最佳参数组合。例如加权移动平均线、移动平均线的顺次平滑等。
增加趋势判断指标,避免震荡行情开仓。例如ADX,布林带等。
优化止损方式,提高止损效果。可考虑追踪止损、Chandelier Exit等止损策略。
增加机器学习方法判断K线形态,提高吞噬识别准确度。
添加自动参数优化功能,实现参数自适应。
总结
本策略以吞噬形态判断反转时机,以价格与移动平均线交叉验证反转方向。通过指标融合提高决策效果,是一种技术分析策略。优点是指标互补,参数灵活;缺点是仍有假信号风险,对震荡行情弱。可通过优化移动平均线参数、止损方式、加入趋势判断等方法进一步增强策略效果。
/*backtest
start: 2023-12-30 00:00:00
end: 2024-01-29 00:00:00
period: 3h
basePeriod: 15m
exchanges: [{"eid":"Futures_Binance","currency":"BTC_USDT"}]
*/

//@version=4
//@author=Daveatt

StrategyName = "BEST Engulfing + MA"
ShortStrategyName = "BEST Engulfing + MA"

strategy(title=StrategyName, shorttitle=ShortStrategyName, overlay=true)

includeEngulfing = true

includeMA = true
source_ma = input(title="Source Price vs MA", type=input.source, defval=close)
typeofMA = input(title="Type of MA", defval="SMA", options=["RMA", "SMA", "EMA", "WMA", "VWMA", "SMMA", "KMA", "TMA", "HullMA", "DEMA", "TEMA"])
length_ma = input(32, title = "MA Length", type=input.integer)

// ---------- Candle components and states
GreenCandle = close > open
RedCandle = close < open
NoBody = close==open
Body = abs(close-open)


// bullish conditions
isBullishEngulfing1 = max(close[1],open[1]) < max(close,open) and min(close[1],open[1]) > min(close,open) and Body > Body[1] and GreenCandle and RedCandle[1]
isBullishEngulfing2 = max(close[1],open[1]) < max(close,open) and min(close[1],open[1]) <= min(close,open) and Body > Body[1] and GreenCandle and RedCandle[1]

// bearish conditions
isBearishEngulfing1 = max(close[1],open[1]) < max(close,open) and min(close[1],open[1]) > min(close,open) and Body > Body[1] and RedCandle and GreenCandle[1]
isBearishEngulfing2 = max(close[1],open[1]) >= max(close,open) and min(close[1],open[1]) > min(close,open) and Body > Body[1] and RedCandle and GreenCandle[1]

// consolidation of conditions
isBullishEngulfing = isBullishEngulfing1 or isBullishEngulfing2
isBearishEngulfing = isBearishEngulfing1 or isBearishEngulfing2

//isBullishEngulfing = max(close[1],open[1]) < max(close,open) and min(close[1],open[1]) > min(close,open) and Body > Body[1] and GreenCandle and RedCandle[1]
//isBearishEngulfing = max(close[1],open[1]) < max(close,open) and min(close[1],open[1]) > min(close,open) and Body > Body[1] and RedCandle and GreenCandle[1]

Engulf_curr = 0 - barssince(isBearishEngulfing) + barssince(isBullishEngulfing)
Engulf_Buy = Engulf_curr < 0 ? 1 : 0
Engulf_Sell = Engulf_curr > 0 ? 1 : 0


// Price vs MM


smma(src, len) =>
    smma = 0.0
    smma := na(smma[1]) ? sma(src, len) : (smma[1] * (len - 1) + src) / len
    smma

ma(smoothing, src, length) =>
    if smoothing == "RMA"
        rma(src, length)
    else
        if smoothing == "SMA"
            sma(src, length)
        else
            if smoothing == "EMA"
                ema(src, length)
            else
                if smoothing == "WMA"
                    wma(src, length)
				else
					if smoothing == "VWMA"
						vwma(src, length)
					else
						if smoothing == "SMMA"
						    smma(src, length)
						else
							if smoothing == "HullMA"
								wma(2 * wma(src, length / 2) - wma(src, length), round(sqrt(length)))
							else
								if smoothing == "LSMA"
									src
								else
								    if smoothing == "KMA"
								        xPrice = src
                                        xvnoise = abs(xPrice - xPrice[1])
                                        nfastend = 0.666
                                        nslowend = 0.0645
                                        nsignal = abs(xPrice - xPrice[length])
                                        nnoise = sum(xvnoise, length)
                                        nefratio = iff(nnoise != 0, nsignal / nnoise, 0)
                                        nsmooth = pow(nefratio * (nfastend - nslowend) + nslowend, 2)
                                        nAMA = 0.0
                                        nAMA := nz(nAMA[1]) + nsmooth * (xPrice - nz(nAMA[1]))
                                        nAMA
								    else
								        if smoothing == "TMA"
									        sma(sma(close, length), length)
						                else
							                if smoothing == "DEMA"
							                    2 * src - ema(src, length)
							                else
							                    if smoothing == "TEMA"
							                        3 * (src - ema(src, length)) + ema(ema(src, length), length)
							                    else
		    							            src


MA = ma(typeofMA, source_ma, length_ma)

plot(MA, color=#006400FF, title="MA breakout", linewidth=3)

macrossover  = crossover (source_ma, MA)
macrossunder = crossunder(source_ma, MA)

since_ma_buy = barssince(macrossover)
since_ma_sell = barssince(macrossunder)
macross_curr = 0 - since_ma_sell + since_ma_buy
bullish_MA_cond = macross_curr < 0 ?  1 : 0
bearish_MA_cond = macross_curr > 0 ? 1  : 0

posUp = (Engulf_Buy ? 1 : 0) + (bullish_MA_cond ? 1 : 0)
posDn = (Engulf_Sell ? 1 : 0) + (bearish_MA_cond ? 1 : 0)

conditionUP = posUp == 2 and posUp[1] < 2
conditionDN = posDn == 2 and posDn[1] < 2


sinceUP = barssince(conditionUP)
sinceDN = barssince(conditionDN)

// primary-first signal of the trend
nUP = crossunder(sinceUP,sinceDN)
nDN = crossover(sinceUP,sinceDN)


// and the following secondary signals

// save of the primary signal
sinceNUP = barssince(nUP)
sinceNDN = barssince(nDN)

buy_trend   = sinceNDN > sinceNUP
sell_trend  = sinceNDN < sinceNUP

// engulfing by
barcolor(nUP ? color.orange : na, title="Bullish condition")
barcolor(nDN ? color.yellow : na, title="Bearish condition")

isLong  = nUP
isShort = nDN

long_entry_price    = valuewhen(nUP, close, 0)
short_entry_price   = valuewhen(nDN, close, 0)

longClose   = close[1] < MA
shortClose  = close[1] > MA

///////////////////////////////////////////////
//* Backtesting Period Selector | Component *//
///////////////////////////////////////////////


StartYear = input(2017, "Backtest Start Year",minval=1980)
StartMonth = input(1, "Backtest Start Month",minval=1,maxval=12)
StartDay = input(1, "Backtest Start Day",minval=1,maxval=31)
testPeriodStart = timestamp(StartYear,StartMonth,StartDay,0,0)

StopYear = input(2020, "Backtest Stop Year",minval=1980)
StopMonth = input(12, "Backtest Stop Month",minval=1,maxval=12)
StopDay = input(31, "Backtest Stop Day",minval=1,maxval=31)
testPeriodStop = timestamp(StopYear,StopMonth,StopDay,0,0)

testPeriod() => true


//////////////////////////
//* Profit Component *//
//////////////////////////

input_tp_pips = input(600, "Backtest Profit Goal (in USD)",minval=0)
input_sl_pips = input(300, "Backtest STOP Goal (in USD)",minval=0)


tp = buy_trend? long_entry_price + input_tp_pips : short_entry_price - input_tp_pips
sl = buy_trend? long_entry_price - input_sl_pips : short_entry_price + input_sl_pips


long_TP_exit  = buy_trend and high >= tp
short_TP_exit = sell_trend and low <= tp

plot(tp, title="TP", style=plot.style_circles, linewidth=3, color=color.blue)
plot(sl, title="SL", style=plot.style_circles, linewidth=3, color=color.red)

if testPeriod()
    strategy.entry("Long", 1, when=isLong)
    strategy.close("Long", when=longClose )
    strategy.exit("XL","Long", limit=tp,  when=buy_trend, stop=sl)


if testPeriod()
    strategy.entry("Short", 0,  when=isShort)
    strategy.close("Short", when=shortClose )
    strategy.exit("XS","Short", when=sell_trend, limit=tp, stop=sl)