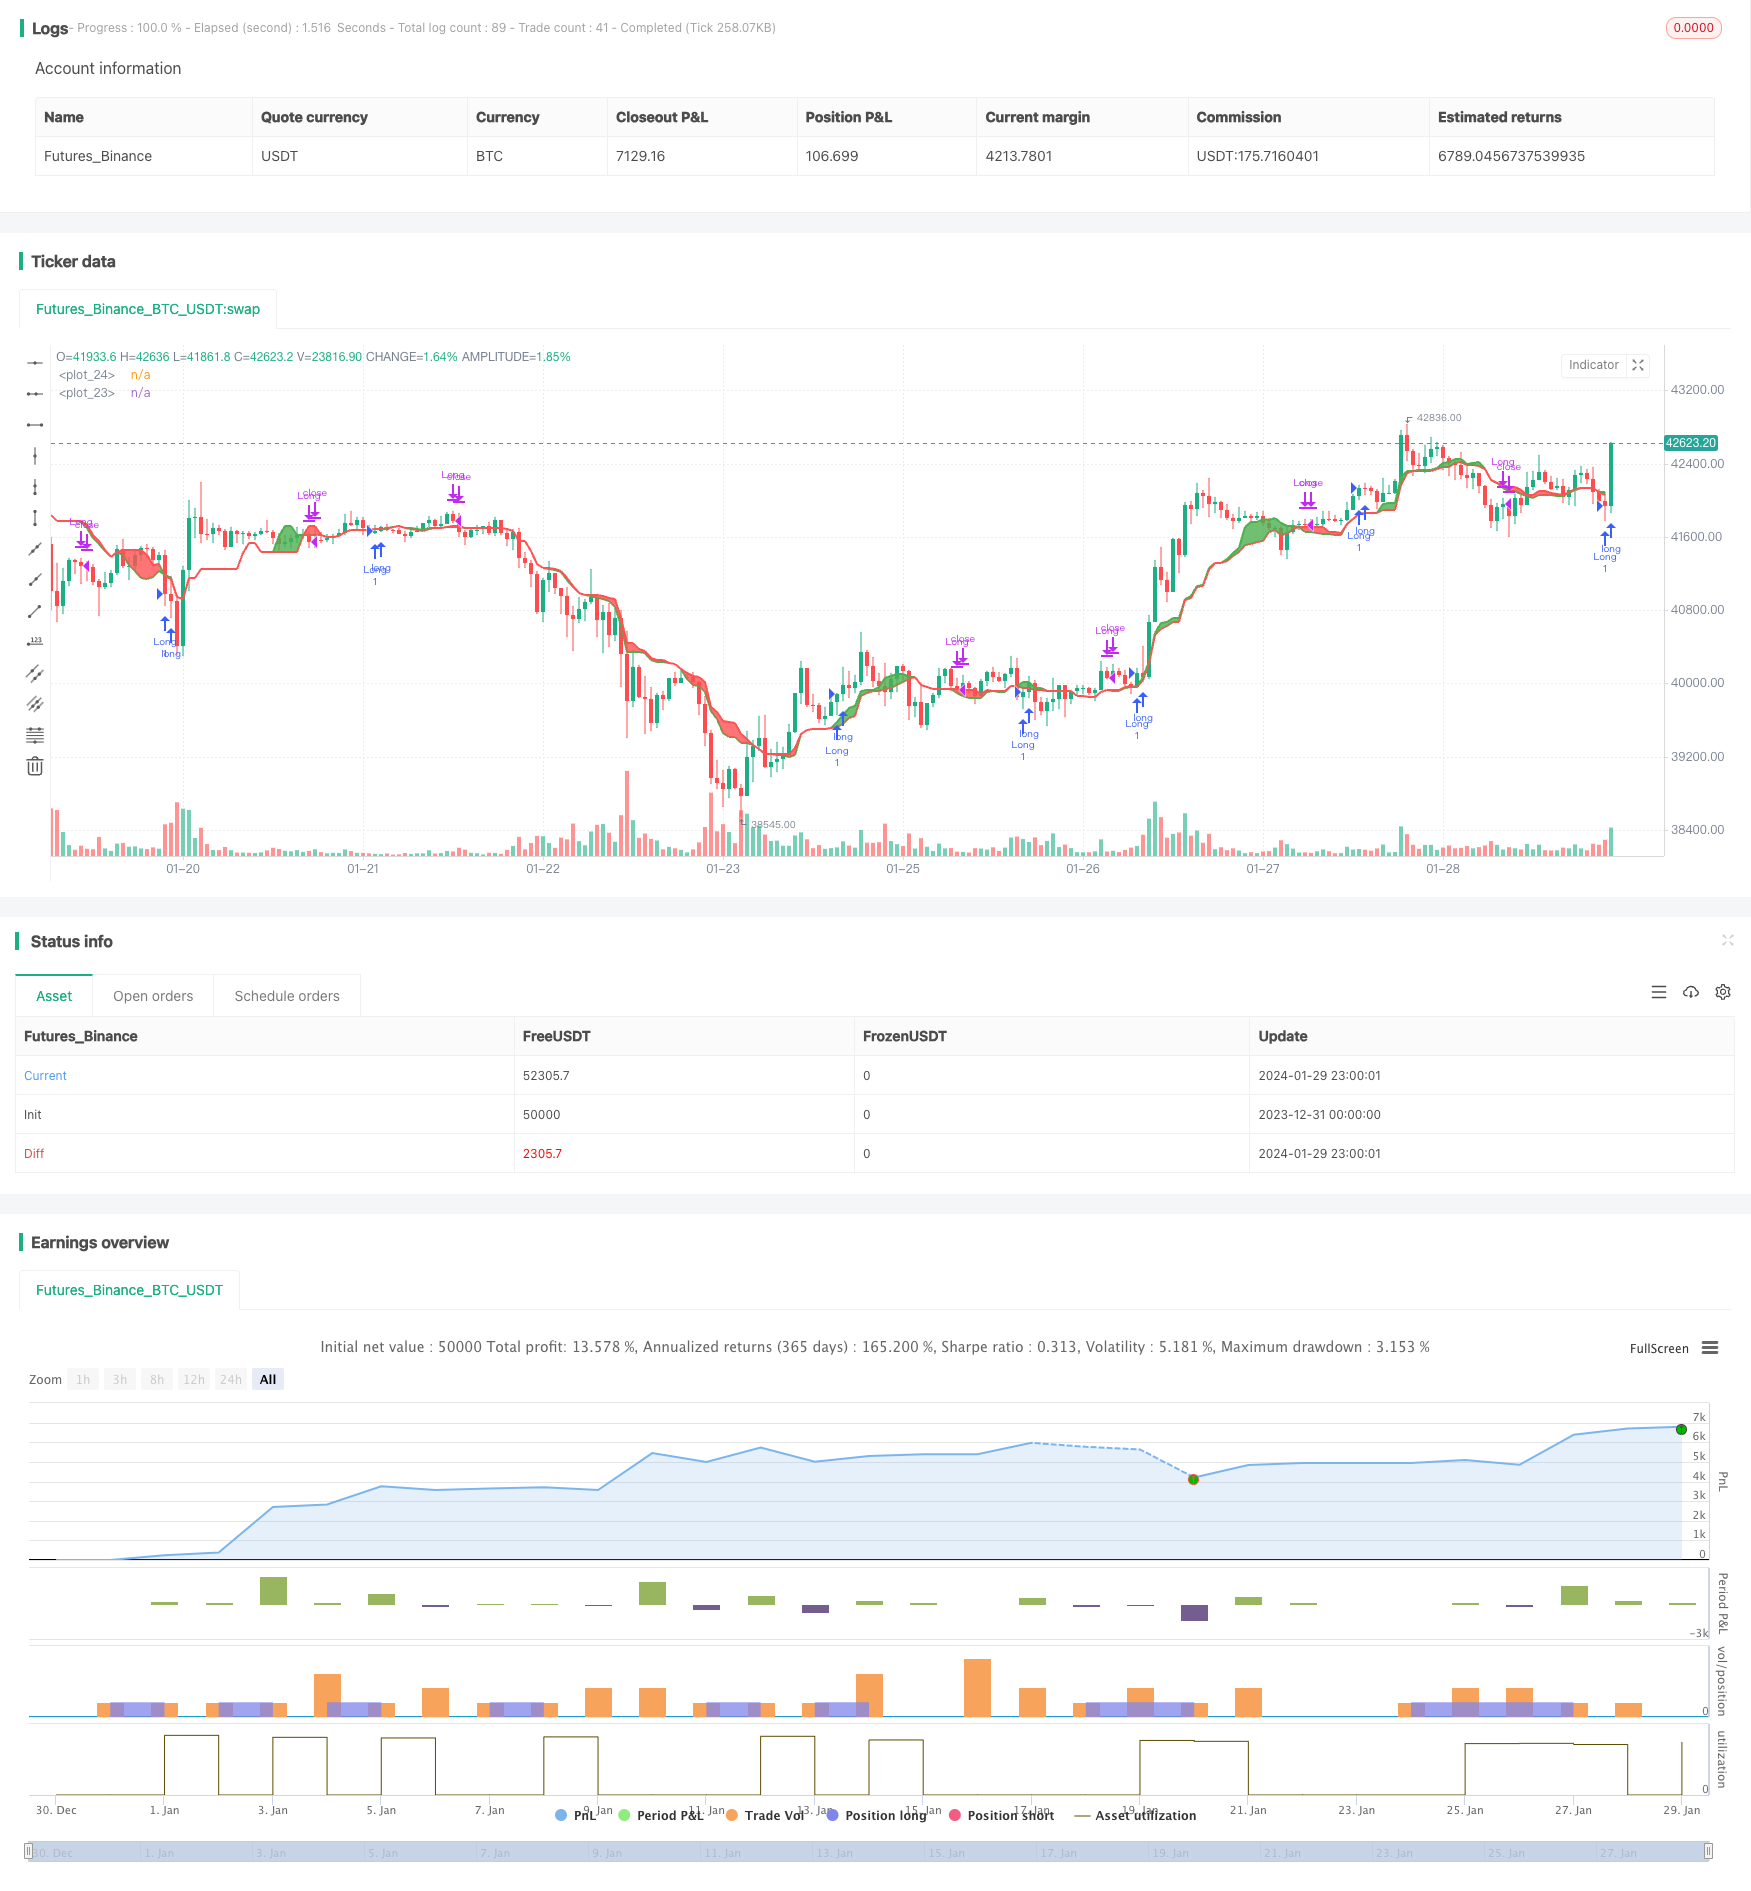
概述
本策略是基于一目均衡表指标设计的比特币交易策略。它通过计算不同周期的最高价、最低价的均值,形成均衡表,当短周期线穿过长周期线时生成交易信号。
策略原理
该策略使用一目均衡表指标,具体计算公式如下:
Lmax = period_max周期内的最高价
Smax = period_max周期内的最低价
Lmed = period_med周期内的最高价
Smed = period_med周期内的最低价
Lmin = period_min周期内的最高价
Smin = period_min周期内的最低价
HL1 = (Lmax + Smax + Lmed + Smed)/4
HL2 = (Lmed + Smed + Lmin + Smin)/4
即分别计算长周期线HL1和短周期线HL2的均衡价。当短周期线HL2上穿长周期线HL1时,做多;当短周期线HL2下穿长周期线HL1时,平仓。
优势分析
该策略具有以下优势:
- 使用一目均衡表指标,可以有效过滤市场噪音,识别趋势。
- 采用不同周期线的交叉作为交易信号,可以减少假信号。
- 策略逻辑简单清晰,容易理解和实现。
- 可自定义周期参数,适应不同市场环境。
风险分析
该策略也存在一些风险:
- 一目均衡表指标存在滞后,可能错过短期信号。
- 长短周期线交叉时,容易被套利。
- 市场剧烈波动时,指标发出的信号可能不可靠。
可以通过适当优化周期参数或结合其他指标来降低这些风险。
优化方向
该策略可以从以下几个方面进行优化:
- 优化长短周期的参数,适应市场变化。
- 增加止损策略,控制亏损。
- 结合其他指标如MACD等,提高信号的准确性。
- 在高波动期间暂停交易,避免巨额亏损。
总结
本策略基于一目均衡表指标,当短期线突破长期线时产生交易信号。相比单一指标,它可以有效过滤假信号。通过参数优化和风险控制,可以进一步提高策略的稳定性和盈利能力。
策略源码
/*backtest
start: 2023-12-31 00:00:00
end: 2024-01-30 00:00:00
period: 1h
basePeriod: 15m
exchanges: [{"eid":"Futures_Binance","currency":"BTC_USDT"}]
*/

// This source code is subject to the terms of the Mozilla Public License 2.0 at https://mozilla.org/MPL/2.0/
// © Alferow

//@version=4
strategy("BTC_ISHIMOKU", overlay=true)

period_max = input(20, minval = 1)
period_med = input(10, minval = 1)
period_min = input(16, minval = 1)

Lmax = highest(high, period_max)
Smax = lowest(low, period_max)

Lmed = highest(high, period_med)
Smed = lowest(low, period_med)

Lmin = highest(high, period_min)
Smin = lowest(low, period_min)

HL1 = (Lmax + Smax + Lmed + Smed)/4
HL2 = (Lmed + Smed + Lmin + Smin)/4

p1 = plot(HL1, color = color.red, linewidth = 2)
p2 = plot(HL2, color = color.green, linewidth = 2)

fill(p1, p2, color = HL1 < HL2 ? color.green : color.red, transp = 90)

start = timestamp(input(2020, minval=1), 01, 01, 00, 00)
finish = timestamp(input(2025, minval=1),01, 01, 00, 00)
trig = time > start and time < finish ? true : false

strategy.entry("Long", true, when = crossover(HL2, HL1) and trig)
// strategy.entry("Short", false, when = crossunder(HL2, HL1) and trig)
strategy.close("Long", when = crossunder(HL2, HL1) and trig)