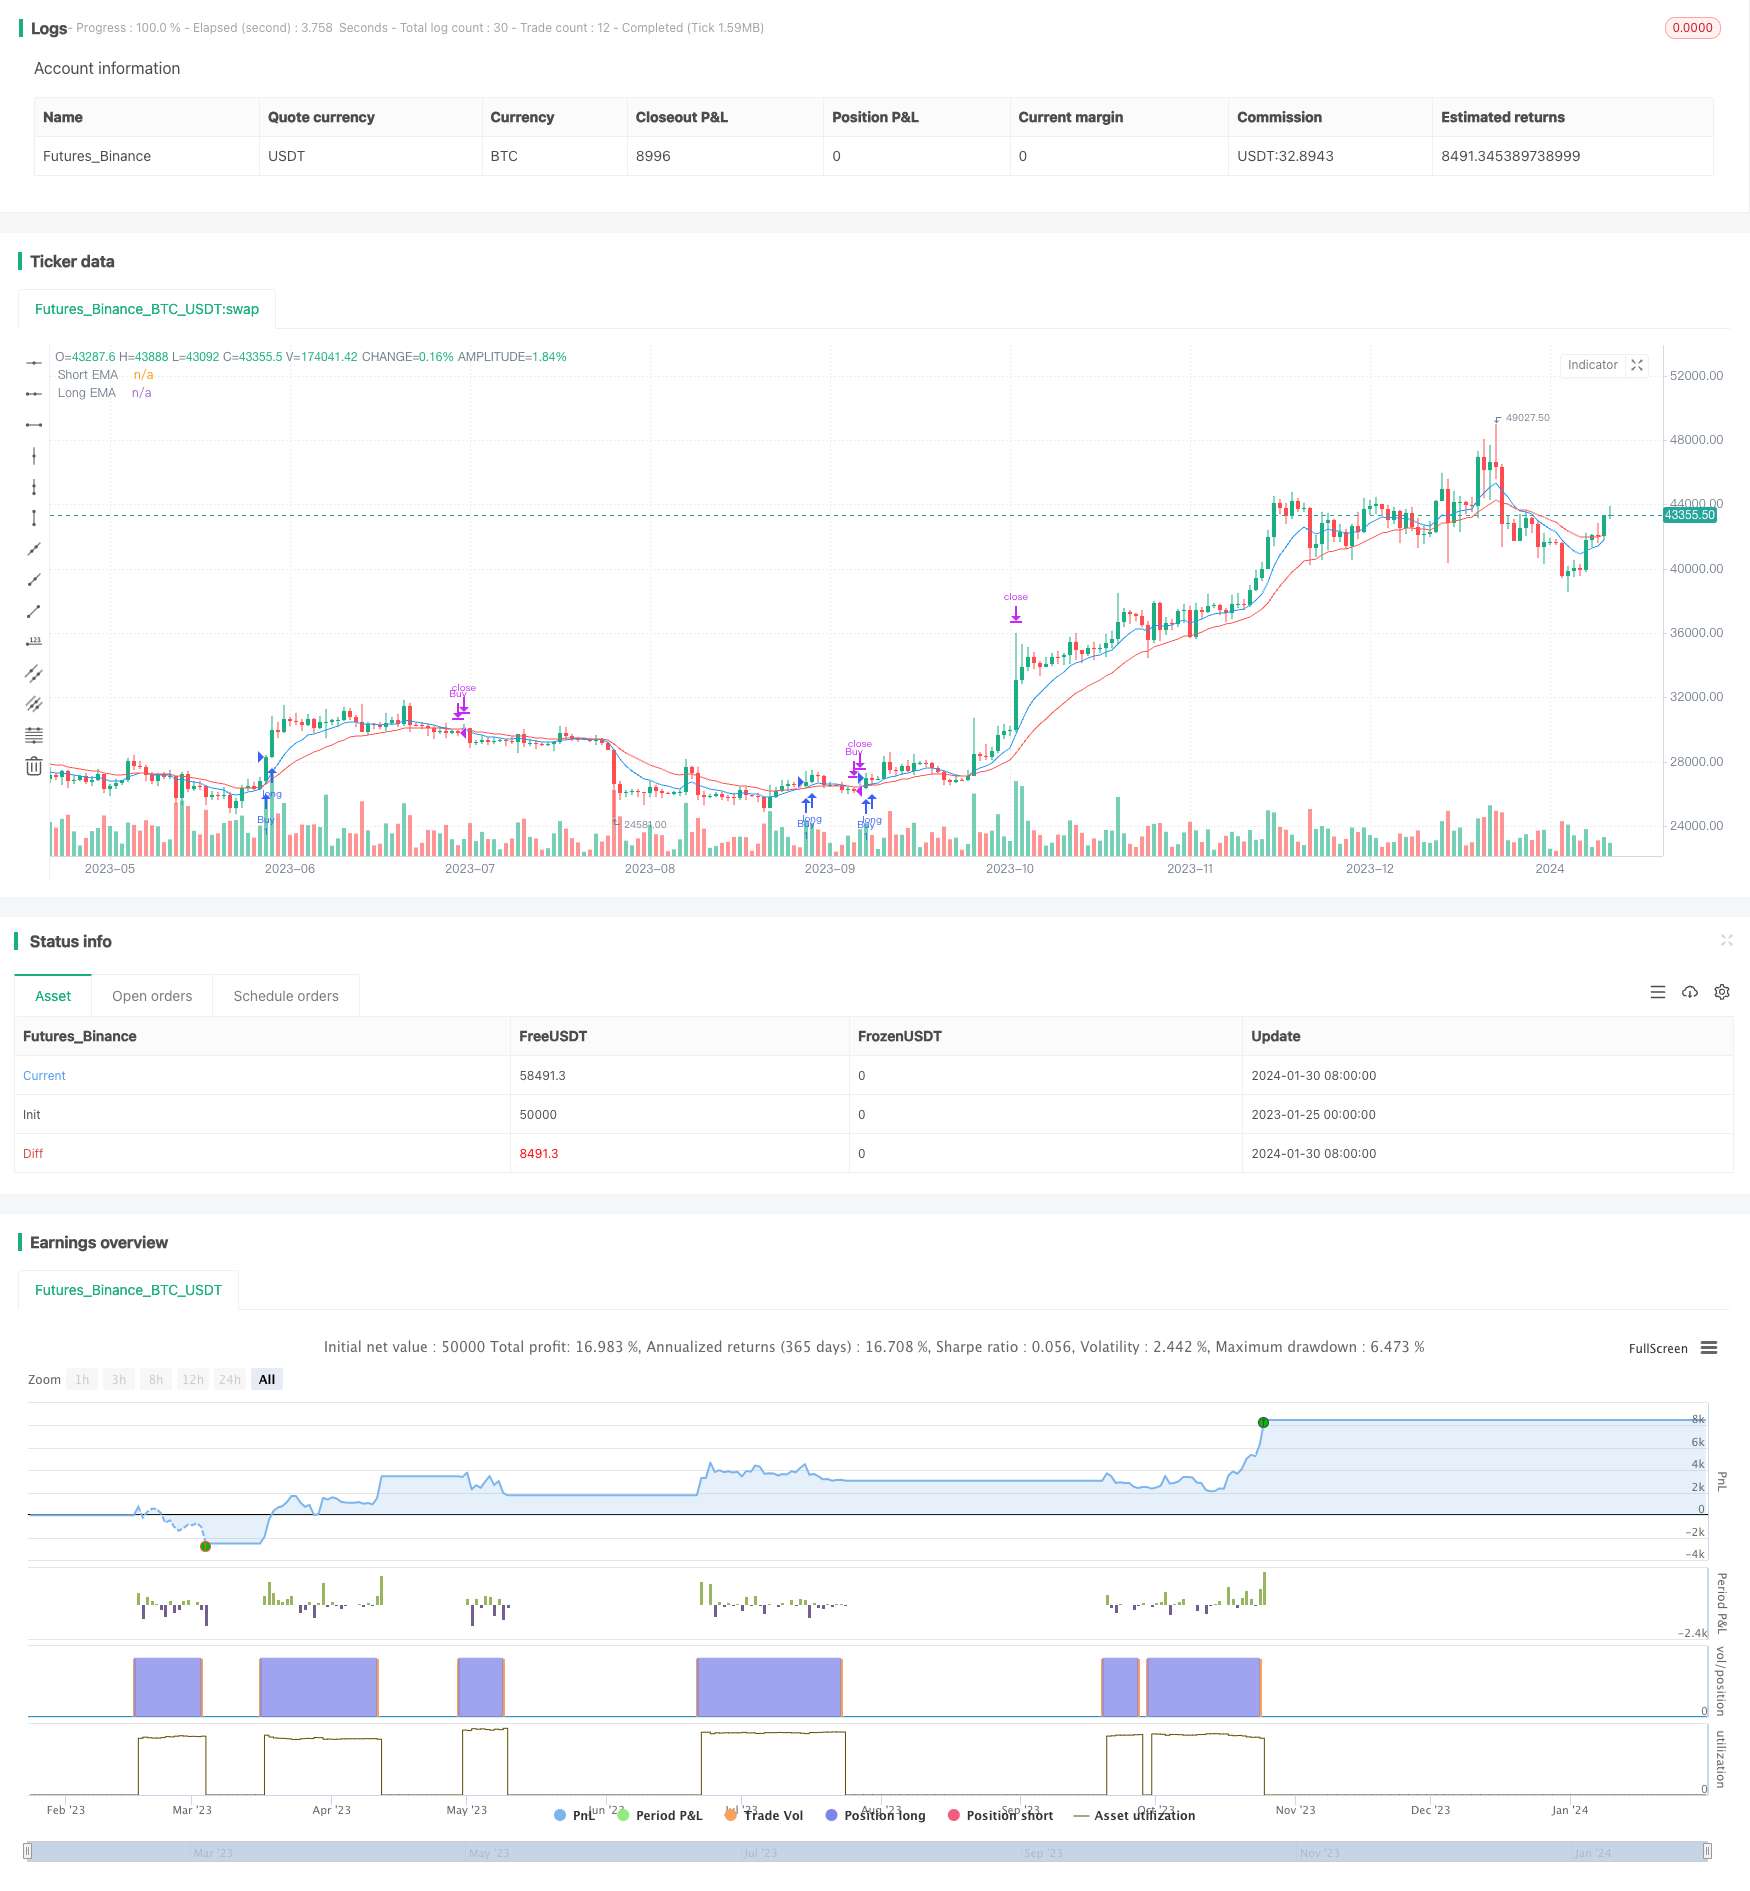
概述
该策略是一个基于EMA指标的简单趋势跟踪策略。它使用两条不同参数的EMA线,一条短期EMA线和一条长期EMA线。当短期EMA线上穿长期EMA线时,做多;当短期EMA线下穿长期EMA线时,平仓。配合止损和止盈管理风险。
策略原理
EMA指标是一种趋势跟踪指标,它对价格进行指数平滑移动平均。短期EMA线能更快地响应价格变化,反映最近期价格趋势;长期EMA线对价格变化响应较慢,能反映长期趋势。当短期EMA线上穿长期EMA线时,表示近期价格上涨势头强于长期趋势,可以做多;反之,短期EMA下穿长期EMA时,表示近期价格下跌势头强于长期趋势,应平掉多单。
该策略设置9周期和21周期的EMA线。使用短期9周期EMA线与长期21周期EMA线的交叉作为交易信号。具体做多和平仓逻辑如下:
- 当9周期EMA上穿21周期EMA时,做多
- 当9周期EMA下穿21周期EMA时,平仓
策略优势
- 使用EMA交叉形成交易信号,避免频繁交易
- EMA平滑价格,有利于识别趋势方向
- 交易逻辑简单易理解
策略风险
- 市场剧烈波动时,EMA指标会滞后,可能带来亏损
- 仅基于单一指标,容易产生假信号
风险解决方法: 1. 优化EMA参数,使其更快响应价格 2. 增加其他指标过滤信号
策略优化方向
- 优化EMA参数,寻找最佳周期组合
- 增加成交量指标或其他指标进行过滤,避免假信号
- 增加动态止损止盈策略
总结
该策略利用两条不同参数EMA的交叉形成交易信号,通过追踪趋势获利。策略优点是简单易操作,交易频率适中,能抓住中长线趋势。但EMA指标存在滞后问题, 信号指示和优化动态止损可以进一步降低风险。总的来说,EMA交叉对于抓取中长期趋势是有效的。
策略源码
/*backtest
start: 2023-01-25 00:00:00
end: 2024-01-31 00:00:00
period: 1d
basePeriod: 1h
exchanges: [{"eid":"Futures_Binance","currency":"BTC_USDT"}]
*/

//@version=4
strategy("EMA Crossover Strategy", overlay=true)

// Input parameters
shortPeriod = input(9, title="Short EMA Period")
longPeriod = input(21, title="Long EMA Period")
stopLossPercent = input(1, title="Stop Loss (%)") / 100
takeProfitMultiplier = input(2, title="Take Profit Multiplier")

// Calculate EMAs
emaShort = ema(close, shortPeriod)
emaLong = ema(close, longPeriod)

// Plot EMAs
plot(emaShort, color=color.blue, title="Short EMA")
plot(emaLong, color=color.red, title="Long EMA")

// Strategy logic
strategy.entry("Buy", strategy.long, when=crossover(emaShort, emaLong))
strategy.close("Buy", when=crossunder(emaShort, emaLong))

// Risk management
atrValue = atr(14)
stopLossLevel = close * (1 - stopLossPercent)
takeProfitLevel = close * takeProfitMultiplier

strategy.exit("Take Profit/Stop Loss", from_entry="Buy", loss=stopLossLevel, profit=takeProfitLevel)