概述
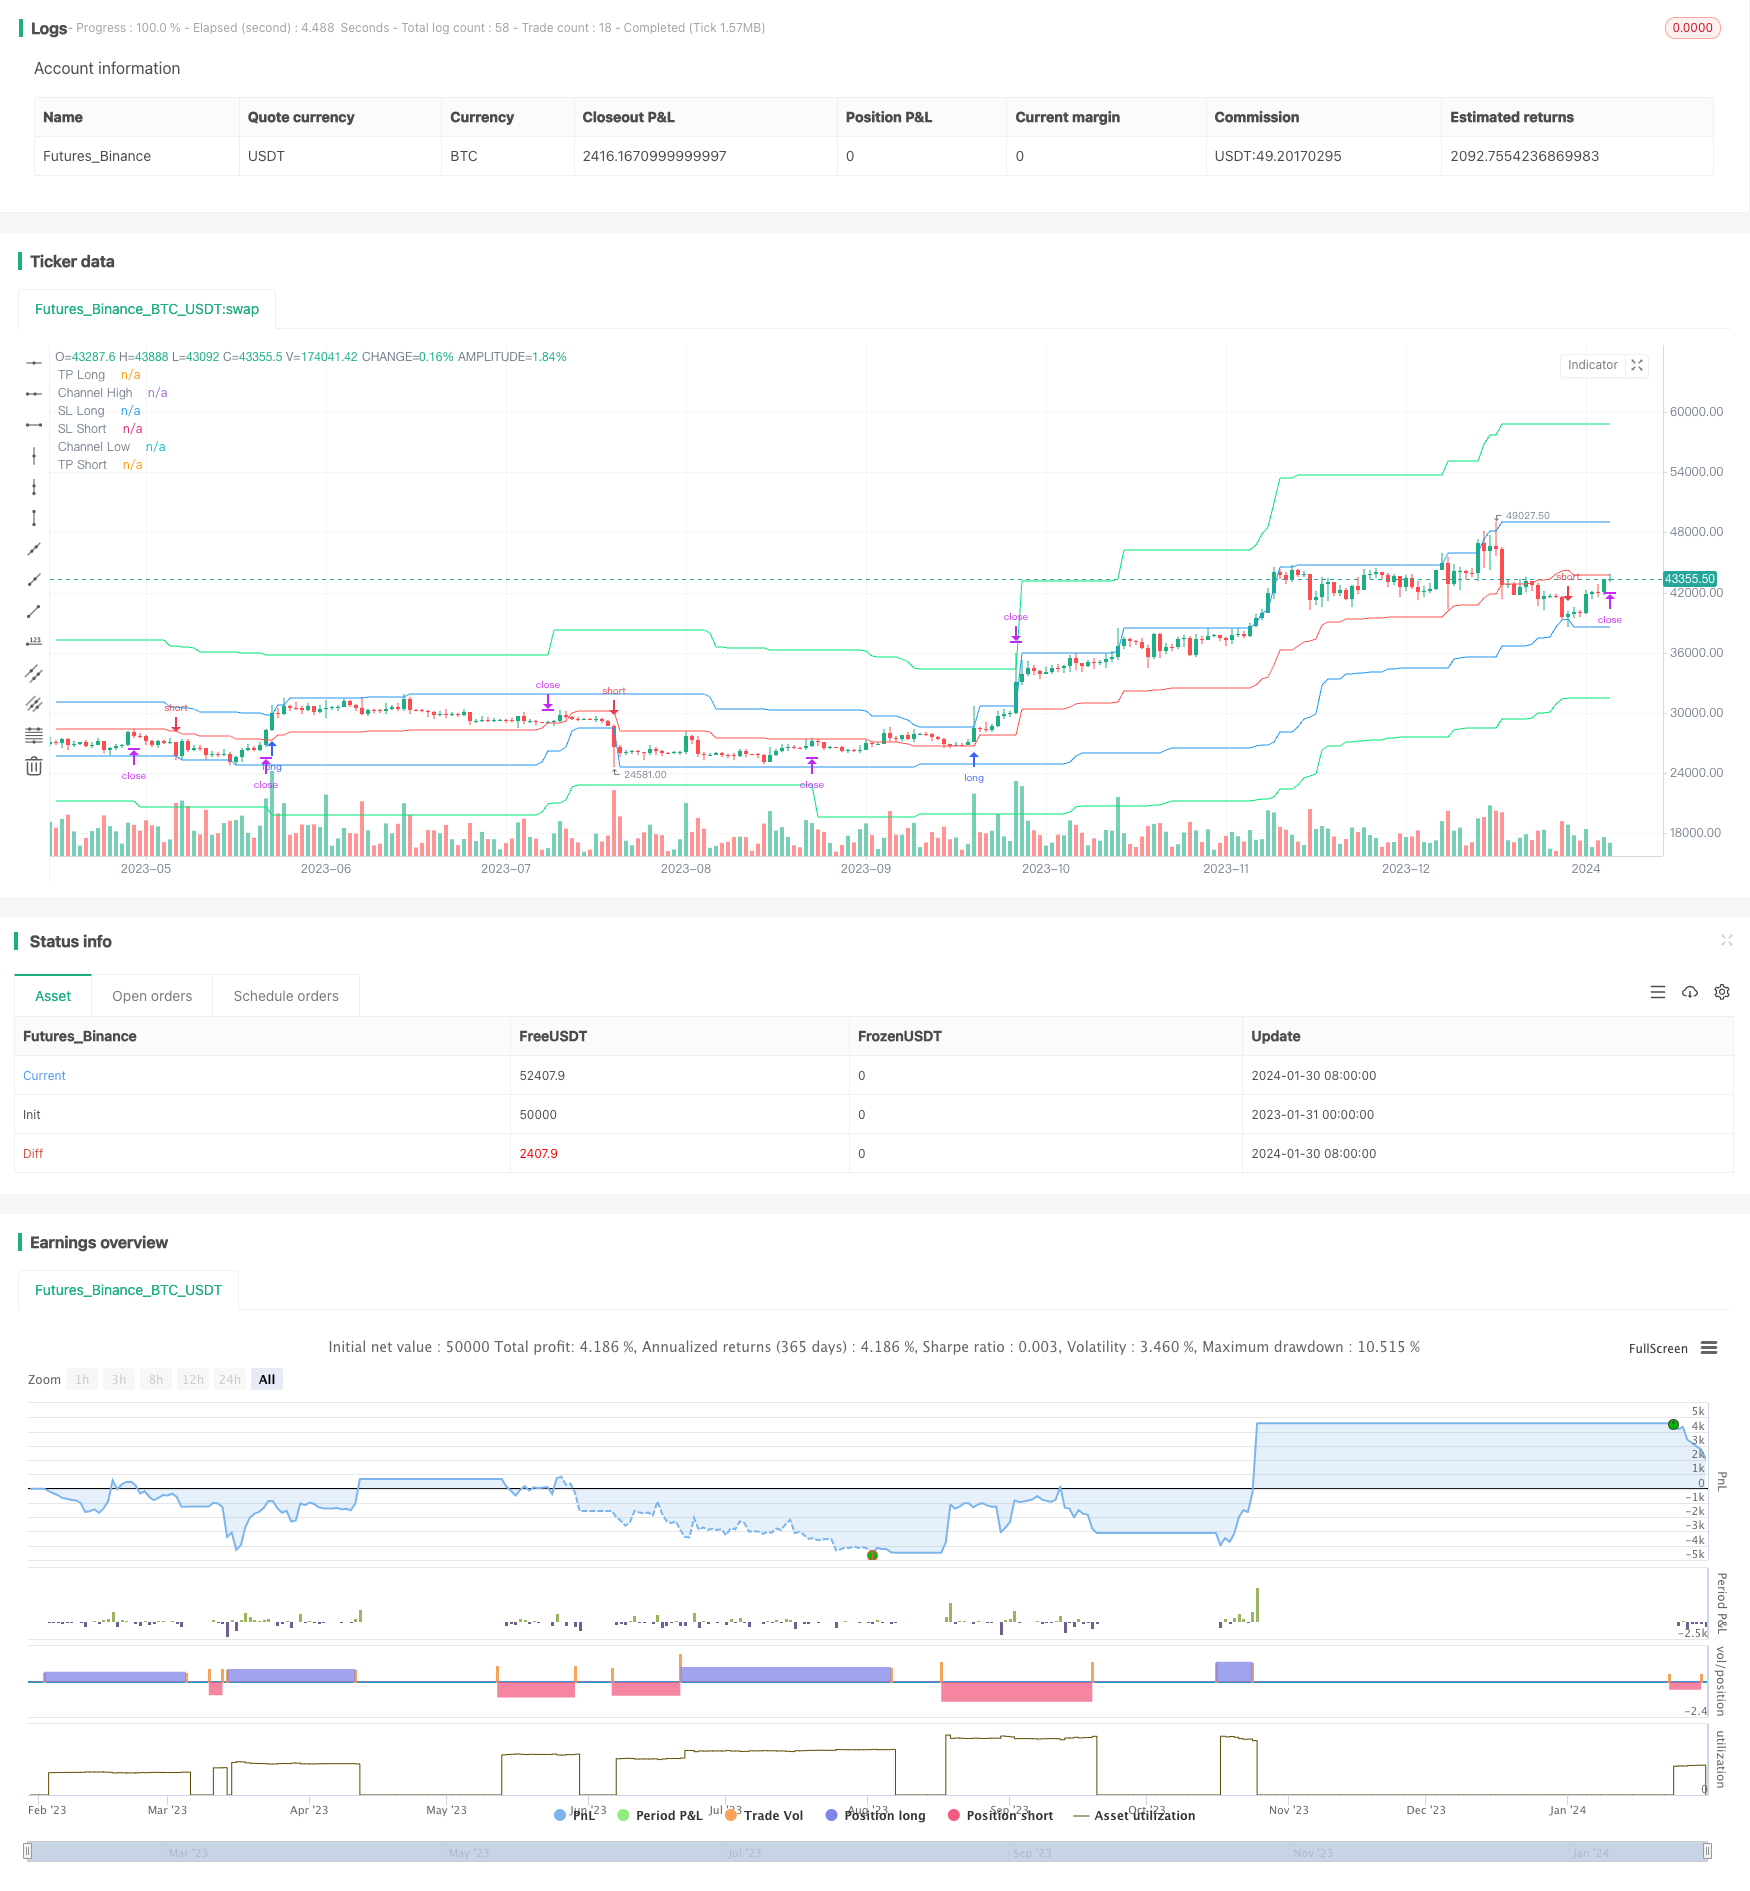
本策略基于Donchian价格通道指标开发。该指标通过计算一定周期内的最高价和最低价,形成价格通道。策略利用价格通道实现双向交易,并设定止损和止盈价格。止损价格固定为价格通道中线,止盈价格设定为价格通道上下限之外的一定百分比。策略还实现了止盈和止损的追踪。
策略原理
首先,策略根据参数pclen计算价格通道的上限h和下限l。中线center为价格通道上下限的平均值。然后根据长仓和空仓的止盈参数tp,计算出止盈价格tpl和tps。止损价格固定为价格通道中线center。当价格突破价格通道时,根据风险大小risklong和riskshort计算出不同方向的交易仓位。策略会在价格重新进入通道时平仓。此外,还设置了时间过滤,只在指定的日期区间内交易。
具体交易逻辑为:
多仓开仓信号:价格大于通道上限h且回落到通道内时开多仓 多仓平仓信号:价格低于通道中线center(止损)或高于止盈价格tpl(止盈)时平多仓
空仓开仓信号:价格小于通道下限l且回落到通道内时开空仓 空仓平仓信号:价格高于通道中线center(止损)或低于止盈价格tps(止盈)时平空仓
优势分析
本策略具有以下优势:
- 双向交易,可以捕捉价格趋势的反转
- 利用价格通道判断趋势方向,避免假突破
- 设定止盈止损,控制风险
- 计算仓位规模关联风险大小,实现风险可控
- 实现止盈和止损的追踪,可以锁定更多利润
风险分析
本策略也存在一定的风险:
- 价格通道参数设置不当可能导致交易频率过高或错过交易机会
- 止损价格过宽容可能增加风险敞口
- 追踪止盈在高波动时期可能提前触发
可以通过调整参数以及人工监控的方式降低和控制这些风险。
优化方向
本策略还可以从以下几个方面进行优化:
- 增加更多指标判断过滤,避免在震荡行情中频繁开平仓
- 可以测试不同的止盈止损算法,如ATR止损等
- 扩展为跨时间周期交易系统,利用更高级时间周期确定趋势方向
- 增加仓位管理模块,根据资金使用比例调整仓位
- 结合机器学习模型判断价格突破的成功率,避免假突破
总结
本策略总体来说是一个利用价格通道指标实现双向交易的有效方法。设置了止盈止损和仓位控制模块,可以很好地控制风险。通过一定的优化和调整,可以成为一个强大的量化交易策略。
策略源码
/*backtest
start: 2023-01-31 00:00:00
end: 2024-01-31 00:00:00
period: 1d
basePeriod: 1h
exchanges: [{"eid":"Futures_Binance","currency":"BTC_USDT"}]
*/

//Noro
//2020

//@version=4
strategy(title = "Noro's RiskDonchian Strategy", shorttitle = "RiskDonchian str", overlay = true, default_qty_type = strategy.percent_of_equity, initial_capital = 100, default_qty_value = 100, commission_value = 0.1)

//Settings
needlong = input(true, defval = true, title = "Long")
needshort = input(true, defval = true, title = "Short")
tp = input(defval = 20.0, minval = 1, title = "Take-profit, %")
tptype = input(defval = "2. Fix", options = ["1. None", "2. Fix", "3. Trailing"], title = "Take-profit type")
sltype = input(defval = "2. Center", options = ["1. None", "2. Center"], title = "Take-profit type")
risklong  = input(5.0, minval = 0.0, maxval = 99.9, title = "Risk size for long, %")
riskshort = input(5.0, minval = 0.0, maxval = 99.9, title = "Risk size for short, %")
pclen = input(50, minval = 1, title = "Price Channel Length")
showll = input(true, defval = true, title = "Show lines")
showbg = input(false, defval = false, title = "Show Background")
showof = input(true, defval = true, title = "Show Offset")
showlabel = input(true, defval = true, title = "Show label")
fromyear = input(1900, defval = 1900, minval = 1900, maxval = 2100, title = "From Year")
toyear = input(2100, defval = 2100, minval = 1900, maxval = 2100, title = "To Year")
frommonth = input(01, defval = 01, minval = 01, maxval = 12, title = "From Month")
tomonth = input(12, defval = 12, minval = 01, maxval = 12, title = "To Month")
fromday = input(01, defval = 01, minval = 01, maxval = 31, title = "From day")
today = input(31, defval = 31, minval = 01, maxval = 31, title = "To day")

//Price Channel
h = highest(high, pclen)
l = lowest(low, pclen)
center = (h + l) / 2

//Take-profit
tpl = 0.0
tpl := tptype == "2. Fix" and strategy.position_size > 0 ? tpl[1] : h * (100 + tp) / 100

//Stop-loss
tps = 0.0
tps := tptype == "2. Fix" and strategy.position_size < 0 ? tps[1] : l * (100 - tp) / 100

//Lines
tplcol = showll and needlong and tptype != "1. None" ? color.lime : na
pclcol = showll and needlong ? color.blue : na
sllcol = showll and needlong and sltype != "1. None" ? color.red : na
tpscol = showll and needshort and tptype != "1. None" ? color.lime : na
pcscol = showll and needshort ? color.blue : na
slscol = showll and needshort and sltype != "1. None" ? color.red : na
offset = showof ? 1 : 0
plot(tpl, offset = offset, color = tplcol, title = "TP Long")
plot(h, offset = offset, color = pclcol, title = "Channel High")
plot(center, offset = offset, color = sllcol, title = "SL Long")
plot(center, offset = offset, color = slscol, title = "SL Short")
plot(l, offset = offset, color = pcscol, title = "Channel Low")
plot(tps, offset = offset, color = tpscol, title = "TP Short")

//Background
size = strategy.position_size
bgcol = showbg == false ? na : size > 0 ? color.lime : size < 0 ? color.red : na
bgcolor(bgcol, transp = 70)

//Lot size
risksizelong = -1 * risklong
risklonga = ((center / h) - 1) * 100
coeflong = abs(risksizelong / risklonga)
lotlong = (strategy.equity / close) * coeflong
risksizeshort = -1 * riskshort
riskshorta = ((center / l) - 1) * 100
coefshort = abs(risksizeshort / riskshorta)
lotshort = (strategy.equity / close) * coefshort

//Trading
truetime = time > timestamp(fromyear, frommonth, fromday, 00, 00) and time < timestamp(toyear, tomonth, today, 23, 59)
mo = 0
mo := strategy.position_size != 0 ? 0 : high >= center[1] and low <= center[1] ? 1 : mo[1]

if h > 0
    longlimit = tptype == "1. None" ? na : tpl
    longstop = sltype == "1. None" ? na : center
    strategy.entry("Long", strategy.long, lotlong, stop = h, when = strategy.position_size <= 0 and needlong and truetime and mo)
    strategy.exit("TP Long", "Long", limit = longlimit, stop = longstop)
    shortlimit = tptype == "1. None" ? na : tps
    shortstop = sltype == "1. None" ? na : center
    strategy.entry("Short", strategy.short, lotshort, stop = l, when = strategy.position_size >= 0 and needshort and truetime and mo)
    strategy.exit("Exit Short", "Short", limit = shortlimit, stop = shortstop)
if time > timestamp(toyear, tomonth, today, 23, 59)
    strategy.close_all()
    strategy.cancel("Long")
    strategy.cancel("Short")

if showlabel

    //Drawdown
    max = 0.0
    max := max(strategy.equity, nz(max[1]))
    dd = (strategy.equity / max - 1) * 100
    min = 100.0
    min := min(dd, nz(min[1]))

    //Label
    min := round(min * 100) / 100
    labeltext = "Drawdown: " + tostring(min) + "%"
    var label la = na
    label.delete(la)
    tc = min > -100 ? color.white : color.red
    osx = timenow + round(change(time)*10)
    osy = highest(100)