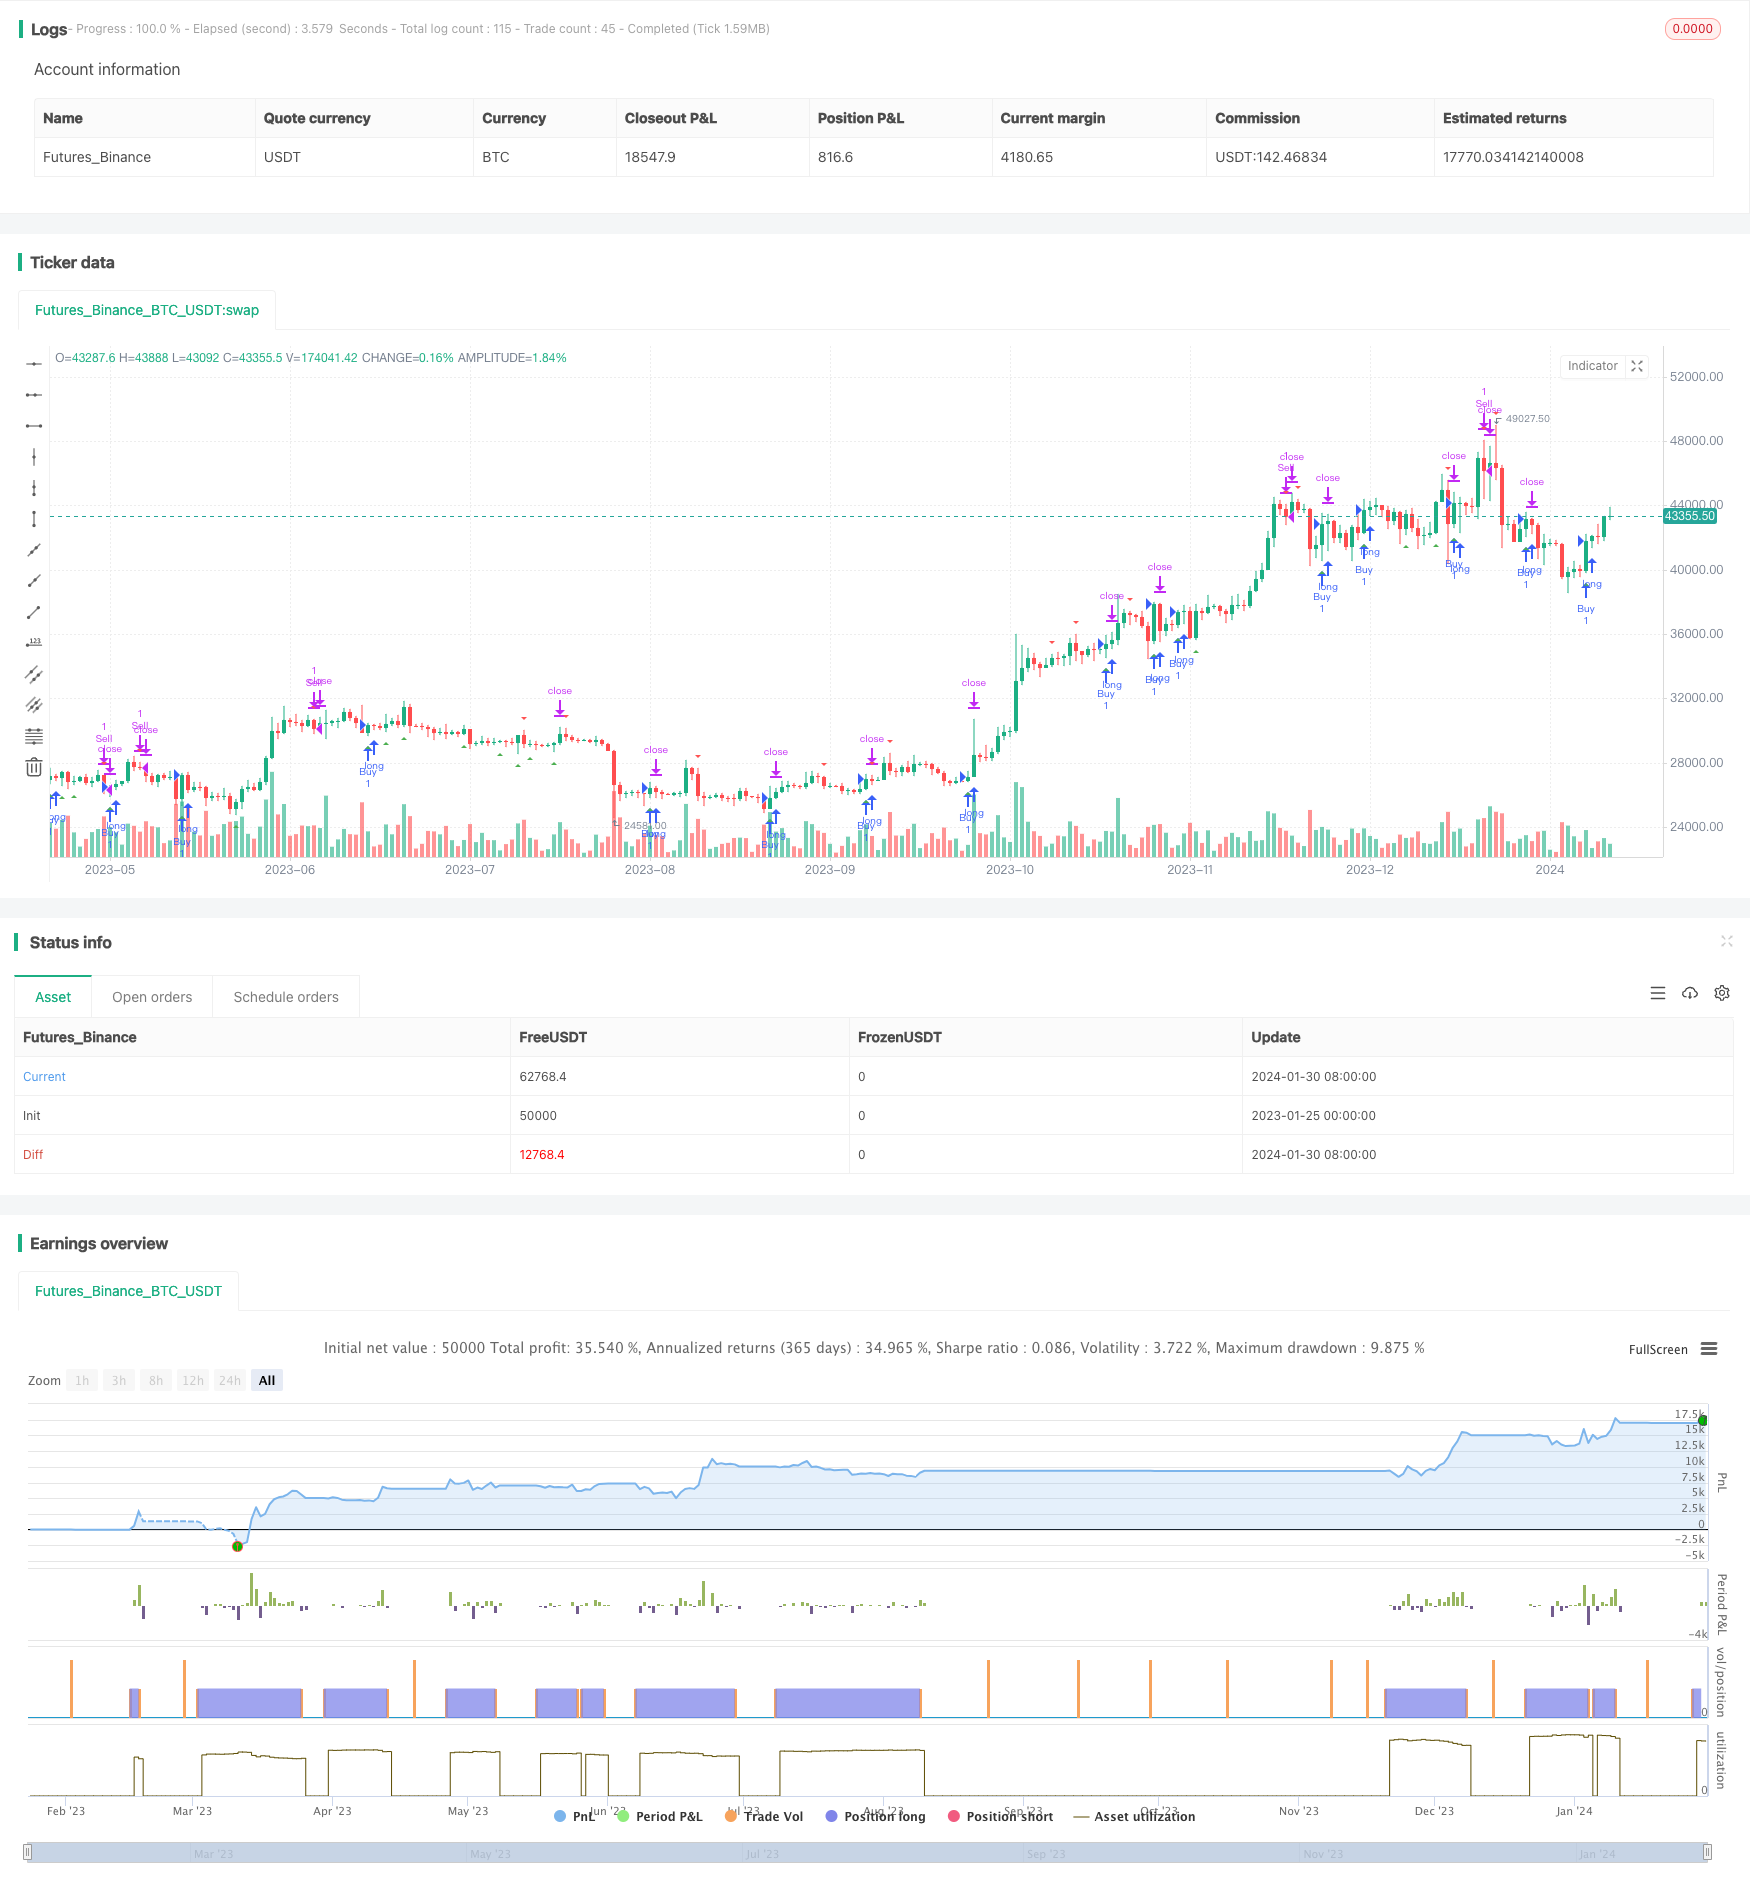
概述
该策略是在比特币和美元的交易对(BTC/USDT)的3分钟时间框架上进行测试,并给出了非常好的结果。该策略结合使用了移动平均线和随机相对强弱指标(Stochastic RSI)来识别交易信号。
策略原理
该策略使用了两个不同期限的简单移动平均线,分别是20周期和50周期。这两个平均线用来判断价格趋势,当短期移动平均线上穿长期移动平均线时为多头信号,下穿为空头信号。
Stochastic RSI指标的计算公式为:(RSI - 最低RSI)/(最高RSI - 最低RSI) * 100。该指标反映了RSI指标当前水平相对于最近一段时间内最高和最低RSI的位置。当Stochastic RSI上穿20时为超卖信号,下穿80时为超买信号。
该策略综合使用移动平均线判断趋势方向,并用Stochastic RSI来定位潜在的反转点作为入场时机。
策略优势分析
与单一使用移动平均线或者Stochastic RSI相比,该策略结合两者优势,可以更好地识别趋势,同时定位潜在反转点,从而提高获利概率。
相比单一指标,该策略综合多种指标并设置严格的入场规则,可以有效过滤假信号,避免无谓交易。
该策略也很好地控制了风险,每次只用2%的资金做保证金交易,可以有效限制单笔损失的影响。
策略风险分析
该策略主要依赖技术指标判定交易信号,如果指标发生失效,将可能产生错误信号导致损失。此外,指标参数设置不当也会影响策略表现。
在行情剧烈波动时,止盈止损设置可能会被突破,导致损失扩大的风险。
策略优化方向
可以测试更多的移动平均线组合和参数,寻找最佳参数组合。也可以尝试其他势能指标如KD、RSI等与移动平均线进行组合。
可以根据不同加密货币的特性选择最佳的止盈止损模式,进一步控制风险。
可以引入机器学习算法自动优化参数设置和信号判断规则,使策略更具鲁棒性和适应性。
总结
该策略成功结合移动平均线和Stochastic RSI指标判定交易信号。相比单一技术指标,该策略可以提供更可靠的交易信号。通过严格的风险控制和参数优化,该策略有望获得稳定利润。
/*backtest
start: 2023-01-25 00:00:00
end: 2024-01-31 00:00:00
period: 1d
basePeriod: 1h
exchanges: [{"eid":"Futures_Binance","currency":"BTC_USDT"}]
*/

//@version=5
strategy("Moving Average and Stochastic RSI Strategy", shorttitle="MA+Stoch RSI", overlay=true)

// Input variables
ma1_length = input.int(20, title="MA1 Length")
ma2_length = input.int(50, title="MA2 Length")
stoch_length = input.int(14, title="Stochastic RSI Length")
overbought = input.int(80, title="Overbought Level")
oversold = input.int(20, title="Oversold Level")
risk_percentage = input.float(2.0, title="Risk Percentage")

// Calculate moving averages
ma1 = ta.sma(close, ma1_length)
ma2 = ta.sma(close, ma2_length)

// Calculate Stochastic RSI
rsi1 = ta.rsi(close, stoch_length)
rsiH = ta.highest(rsi1, stoch_length)
rsiL = ta.lowest(rsi1, stoch_length)
stoch = (rsi1 - rsiL) / (rsiH - rsiL) * 100

// Determine buy and sell signals based on Stochastic RSI
buySignal = ta.crossover(stoch, oversold)
sellSignal = ta.crossunder(stoch, overbought)

// Plot signals on the chart
plotshape(buySignal, style=shape.triangleup, location=location.belowbar, color=color.green, size=size.small)
plotshape(sellSignal, style=shape.triangledown, location=location.abovebar, color=color.red, size=size.small)

// Calculate position size based on equity and risk percentage
equity = strategy.equity
riskAmount = equity * risk_percentage / 100
positionSize = riskAmount / ta.atr(14)

// Entry and exit conditions
var float stopLoss = na
var float takeProfit = na

if buySignal
    stopLoss := low
    takeProfit := high
    strategy.entry("Buy", strategy.long)
else if sellSignal
    strategy.exit("Sell", from_entry="Buy", stop=stopLoss, limit=takeProfit)