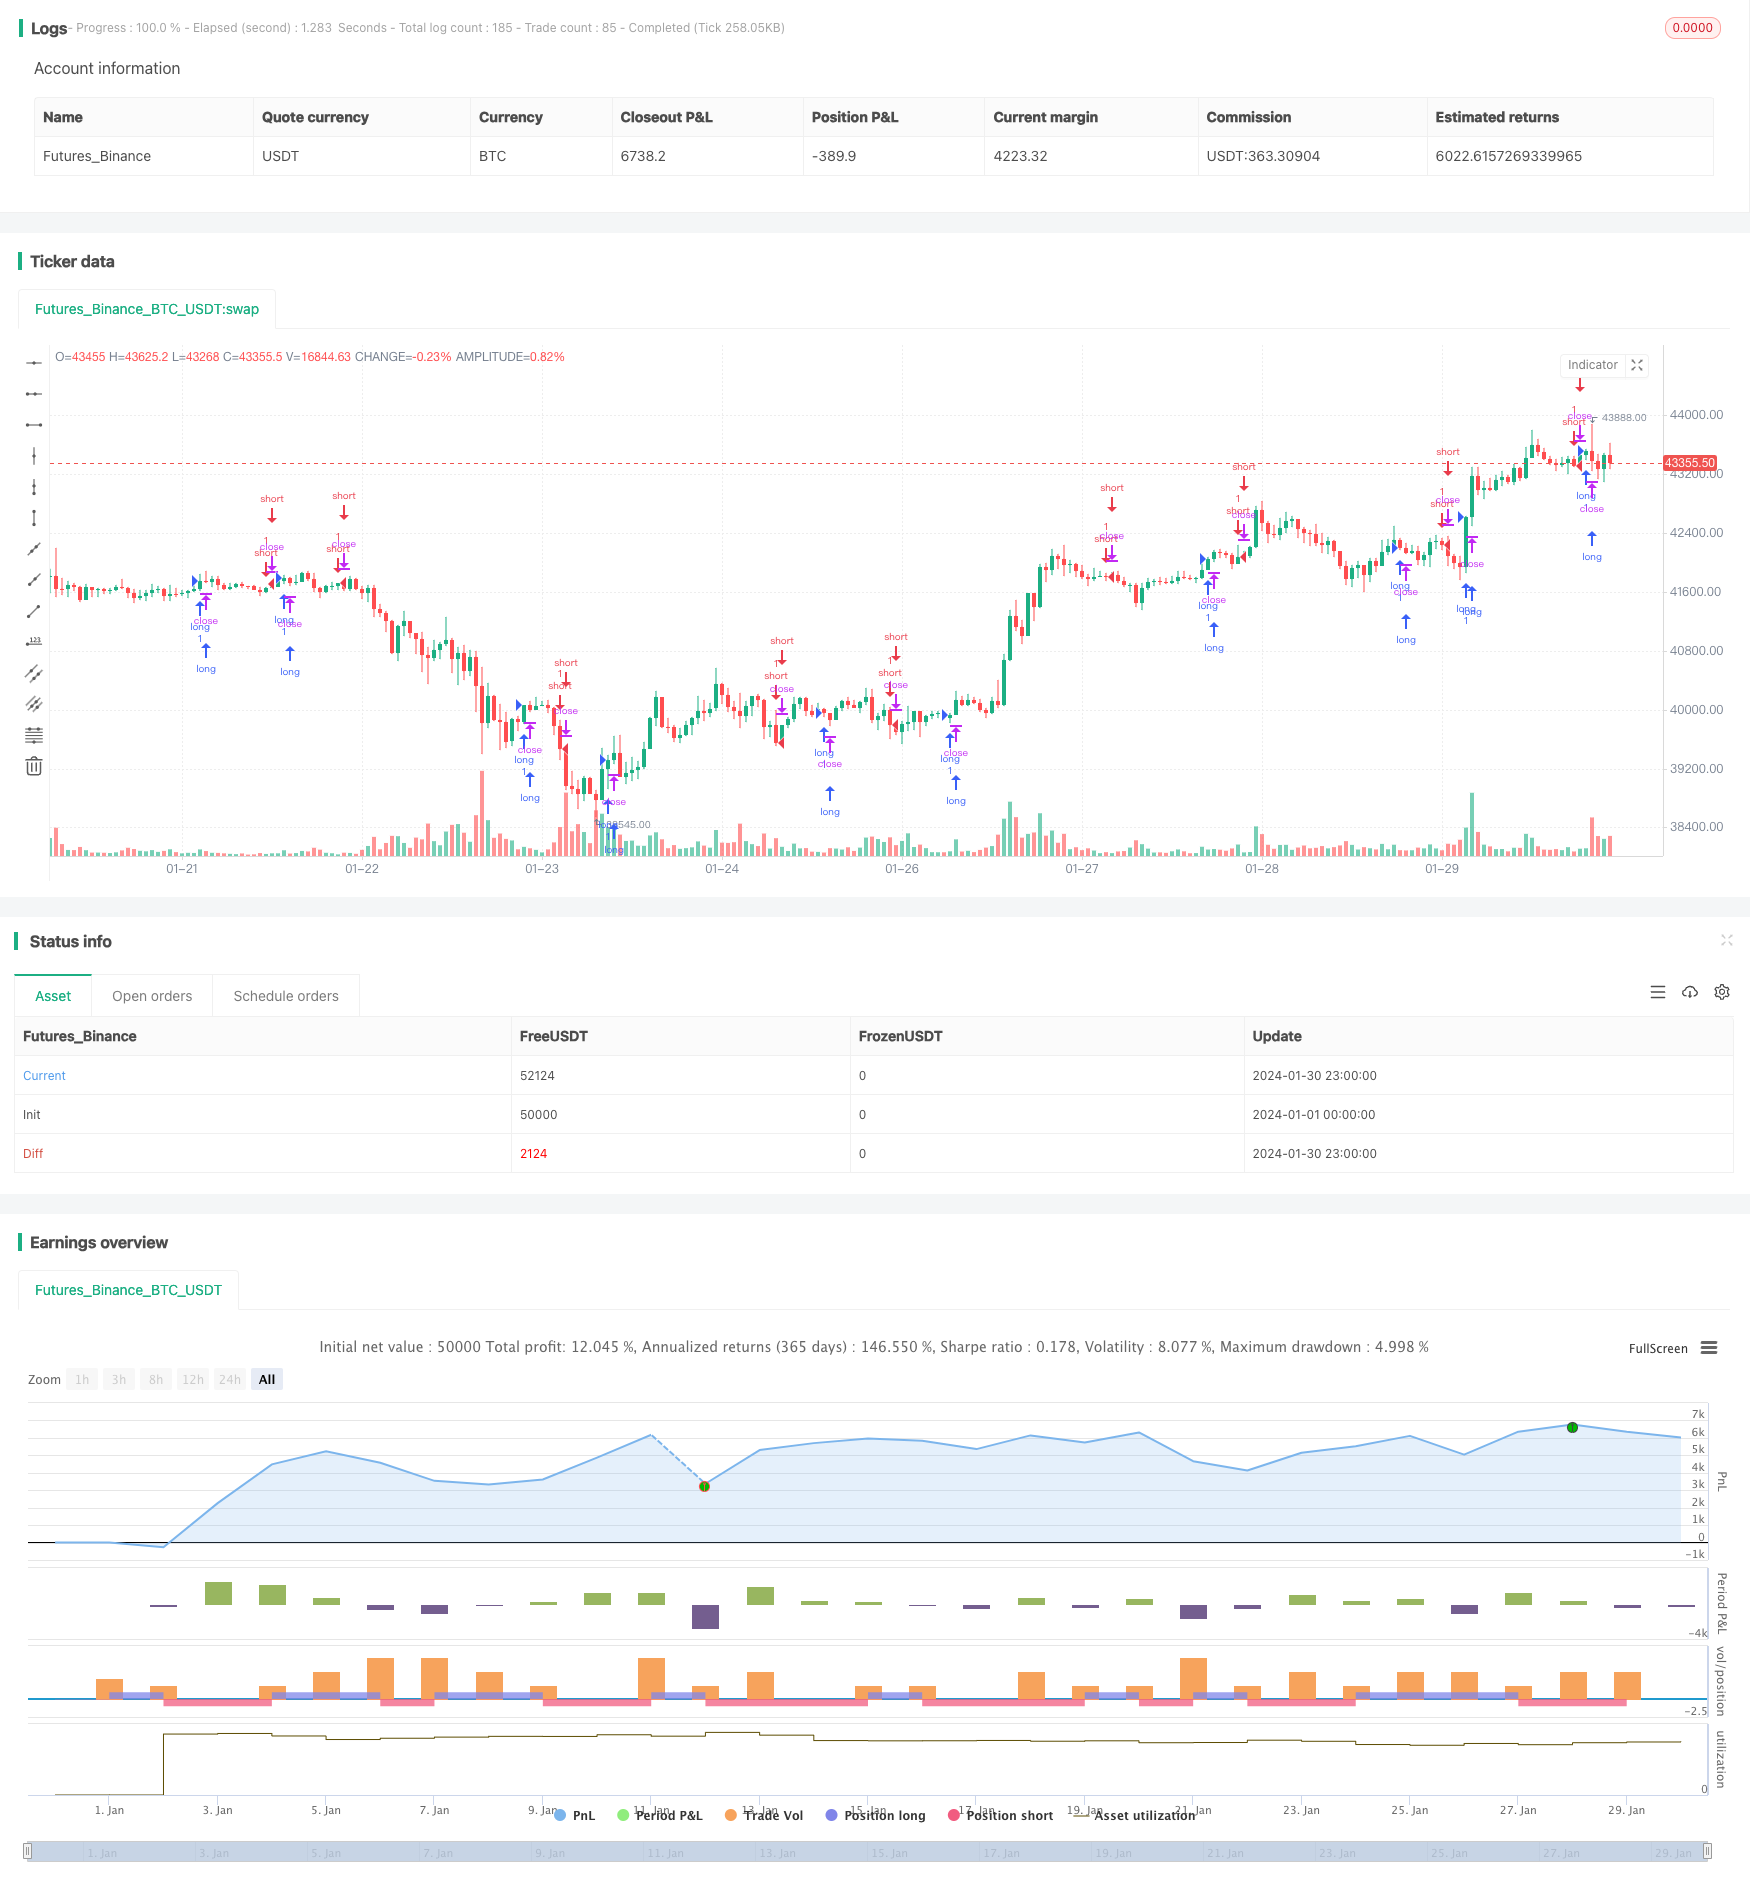
This strategy is a cryptocurrency trading strategy based on a combination of the MACD indicator and stochastic indicators. It generates trading signals by calculating the MACD indicator of bitcoin prices and applying stochastic indicators on it, in order to capture trend changes in the cryptocurrency market.
The strategy first calculates the MACD indicator. MACD stands for Moving Average Convergence Divergence, which is a trend-following indicator. It consists of a fast line and a slow line, where the fast line is a shorter-term exponential moving average and the slow line is a longer-term exponential moving average. When the fast line crosses above the slow line, it generates a golden cross signal, indicating a bullish market. When the fast line crosses below the slow line, it generates a death cross signal, indicating a bearish market.
After calculating the MACD indicator, the strategy applies the stochastic indicator %K on the MACD itself. The calculation formula for %K is:
%K = (Current Close - Lowest Low over N periods) / (Highest High over N periods - Lowest Low over N periods) * 100
The stochastic indicator reflects the price deviation from its recent range. The fluctuation of %K between 20-80 represents the price is trading in consolidation. When %K crosses above 20 from below, it generates a buy signal. When %K crosses below 80 from above, it generates a sell signal.
This strategy combines the trading signals from both the MACD and stochastic %K to trade in the cryptocurrency market. It generates a buy signal when %K crosses above 20 and a sell signal when %K crosses below 80.
This strategy combines trend analysis and overbought-oversold indicators, which can effectively identify important turning points in the market. Compared to using MACD or stochastic alone, the combination of %K and MACD increases the reliability of trading signals and reduces false signals.
In addition, this strategy applies technical indicators commonly used in stock markets to cryptocurrency trading. This is a cross-market application. These indicators are equally applicable in the digital currency market, and may even perform better due to the high volatility of cryptocurrencies.
The biggest risk of this strategy is the high volatility in the cryptocurrency market, which easily produces false signals and leads to trading losses. In addition, when indicators generate signals, prices may have already moved substantially, posing the risk of missing early trend signals.
To control these risks, it is advisable to use moving stop loss to lock in profits and avoid further losses. At the same time, parameters can also be adjusted appropriately to discover more potential opportunities using different time frame lengths.
Firstly, the strategy can try to combine moving averages with volatility indicators such as Bollinger Bands, setting volatility parameters to identify the validity of breakouts and avoid false signals.
Secondly, machine learning models can be introduced to train on historical data and establish random forest or LSTM neural network models to assist in judging the effectiveness of indicator signals.
Thirdly, add a stop loss mechanism. When prices move more than a certain range in an unfavorable direction, automatically trigger stop loss to control risks.
This strategy combines the MACD indicator and the stochastic indicator %K, using the method of mutually verifying signals from two indicators to formulate a cryptocurrency trading strategy. This combination indicator strategy can improve the accuracy of signals to some extent. But we also need to be aware of the risk of over-complication of indicators, which may introduce noise and lagging effects. Proper parameter tuning and risk control according to different market environments are equally important for obtaining better strategy performance.
/*backtest start: 2024-01-01 00:00:00 end: 2024-01-31 00:00:00 period: 1h basePeriod: 15m exchanges: [{"eid":"Futures_Binance","currency":"BTC_USDT"}] */ //@version=3 strategy("Schaff Trend Cycle Strategy", shorttitle="STC Backtest", overlay=true) fastLength = input(title="MACD Fast Length", defval=23) slowLength = input(title="MACD Slow Length", defval=50) cycleLength = input(title="Cycle Length", defval=10) d1Length = input(title="1st %D Length", defval=3) d2Length = input(title="2nd %D Length", defval=3) src = input(title="Source", defval=close) highlightBreakouts = input(title="Highlight Breakouts ?", type=bool, defval=true) macd = ema(src, fastLength) - ema(src, slowLength) k = nz(fixnan(stoch(macd, macd, macd, cycleLength))) d = ema(k, d1Length) kd = nz(fixnan(stoch(d, d, d, cycleLength))) stc = ema(kd, d2Length) stc := stc > 100 ? 100 : stc < 0 ? 0 : stc upper = input(75, defval=75) lower = input(25, defval=25) long = crossover(stc, lower) ? lower : na short = crossunder(stc, upper) ? upper : na long_filt = long and not short short_filt = short and not long prev = 0 prev := long_filt ? 1 : short_filt ? -1 : prev[1] long_final = long_filt and prev[1] == -1 short_final = short_filt and prev[1] == 1 //alertcondition(long_final, "Long", message="Long") //alertcondition(short_final,"Short", message="Short") //plotshape(long_final, style=shape.arrowup, text="Long", color=green, location=location.belowbar) //plotshape(short_final, style=shape.arrowdown, text="Short", color=red, location=location.abovebar) strategy.entry("long", strategy.long, when = long ) strategy.entry("short", strategy.short, when = short)template: strategy.tpl:40:21: executing "strategy.tpl" at <.api.GetStrategyListByName>: wrong number of args for GetStrategyListByName: want 7 got 6