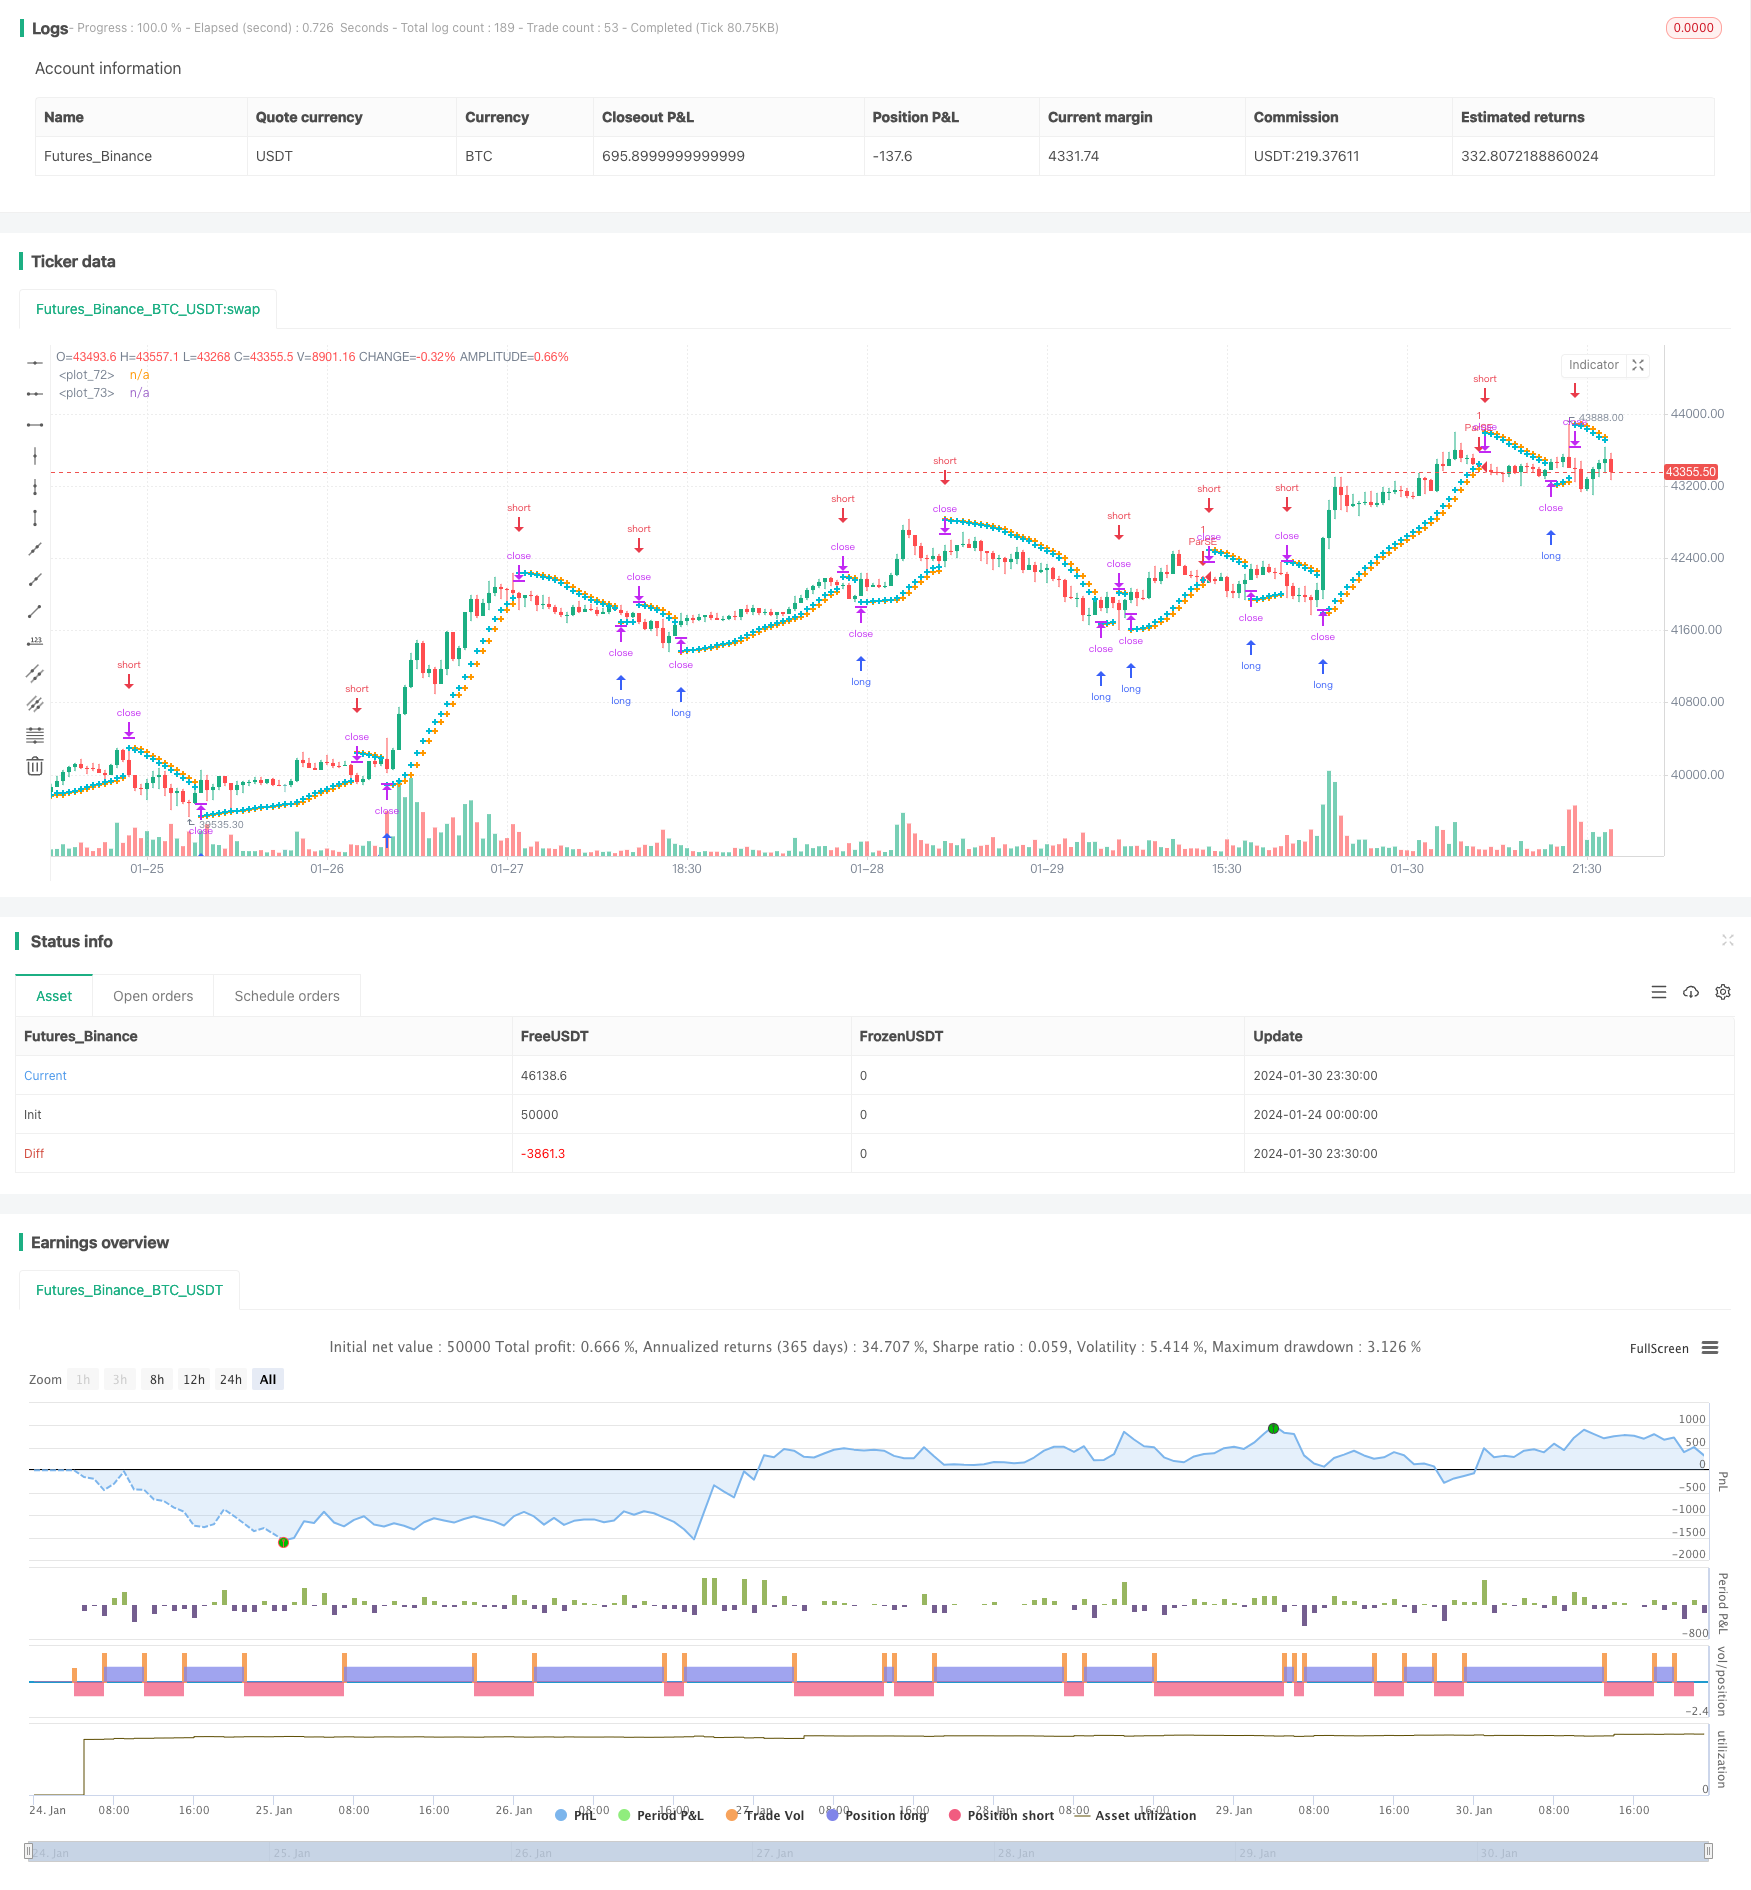
概述
趋势跟踪止损反转策略是一个利用 Parabolic SAR 指标来识别趋势,并在趋势反转时进入反向头寸的策略。该策略同时结合了止损和止盈机制来控制风险。
策略原理
该策略使用 Parabolic SAR 指标来判断当前市场趋势。Parabolic SAR full name is “Parabolic Stop and Reverse”,表示抛物线止损反转。它的指标线在价格图上像一系列抛物线,这些抛物线点代表可能的反转点。
当 SAR 点下降且低于价格时,代表看涨趋势;当 SAR 点上升且高于价格时,代表看跌趋势。该策略就是根据 SAR 点位置来判断目前的趋势方向。
具体来说,当 SAR 点上升趋势且高于价格时,策略会做空头寸;当 SAR 点下降趋势且低于价格时,策略会做多头寸。也就是在 SAR 点显示趋势反转时,进入反向头寸。
此外,该策略还设置了止损和止盈机制。做多时,有可能设置止损价格来限制亏损;同时有可能设置止盈价格,在价格达到一定目标利润后平仓。做空也是类似的机制。
优势分析
该策略结合趋势指标和止损/止盈机制,有以下主要优势:
- 能够及时捕捉趋势反转机会,实现反向操作。
- 设置止损和止盈后,可以主动控制风险和盈利。
- Parabolic SAR 是相当常用的趋势反转指标,效果较好。
- 策略规则简单清晰,容易理解和实现。
风险分析
该策略也存在一些风险需要注意:
- Parabolic SAR 指标并不完美,有时候会发出错误信号。
- 设置止损或止盈价格需要合理,否则可能过早止损或止盈。
- 交易手续费也会影响最终利润。
- 反转后新的趋势lengthening可能比较短暂。
针对这些风险,可以通过调整参数优化,或配合其他指标过滤来解决。
优化方向
该策略可以从以下几个方向进行优化:
- 优化 Parabolic SAR 的参数,寻找最佳参数组合。
- 尝试不同的止损止盈策略,如尾随止损等。
- 增加指标或条件来过滤反转交易信号。
- 添加仓位控制,根据市场情况扩大或缩小仓位。
- 针对不同交易品种调整参数。
总结
该趋势跟踪止损反转策略,整体来说是一个较为经典的交易策略思路。它起到了识别趋势反转的功能,同时辅以止损和止盈手段控制风险。通过优化可以成为一个值得实盘的策略思路。
策略源码
/*backtest
start: 2024-01-24 00:00:00
end: 2024-01-31 00:00:00
period: 30m
basePeriod: 15m
exchanges: [{"eid":"Futures_Binance","currency":"BTC_USDT"}]
*/

//@version=4
strategy("Parabolic SAR Strategy", overlay=true)
start = input(0.02)
increment = input(0.02)
maximum = input(0.2)
var bool uptrend = na
var float EP = na
var float SAR = na
var float AF = start
var float nextBarSAR = na
if bar_index > 0
	firstTrendBar = false
	SAR := nextBarSAR
	if bar_index == 1
		float prevSAR = na
		float prevEP = na
		lowPrev = low[1]
		highPrev = high[1]
		closeCur = close
		closePrev = close[1]
		if closeCur > closePrev
			uptrend := true
			EP := high
			prevSAR := lowPrev
			prevEP := high
		else
			uptrend := false
			EP := low
			prevSAR := highPrev
			prevEP := low
		firstTrendBar := true
		SAR := prevSAR + start * (prevEP - prevSAR)
	if uptrend
		if SAR > low
			firstTrendBar := true
			uptrend := false
			SAR := max(EP, high)
			EP := low
			AF := start
	else
		if SAR < high
			firstTrendBar := true
			uptrend := true
			SAR := min(EP, low)
			EP := high
			AF := start
	if not firstTrendBar
		if uptrend
			if high > EP
				EP := high
				AF := min(AF + increment, maximum)
		else
			if low < EP
				EP := low
				AF := min(AF + increment, maximum)
	if uptrend
		SAR := min(SAR, low[1])
		if bar_index > 1
			SAR := min(SAR, low[2])
	else
		SAR := max(SAR, high[1])
		if bar_index > 1
			SAR := max(SAR, high[2])
	nextBarSAR := SAR + AF * (EP - SAR)
	if barstate.isconfirmed
		if uptrend
			strategy.entry("ParSE", strategy.short, stop=nextBarSAR, comment="ParSE")
			strategy.cancel("ParLE")
		else
			strategy.entry("ParLE", strategy.long, stop=nextBarSAR, comment="ParLE")
			strategy.cancel("ParSE")
plot(SAR, style=plot.style_cross, linewidth=3, color=color.orange)
plot(nextBarSAR, style=plot.style_cross, linewidth=3, color=color.aqua)
//Stop Loss Inputs
use_short_stop_loss = input(false, title="Short Stop Loss", group="Stop Loss and Take Profit", inline="Short_SL")
short_stop_loss = input(title="(%)", type=input.float, minval=0.0, step=0.1,
     defval=5, group="Stop Loss and Take Profit", inline="Short_SL") * 0.01
use_long_stop_loss = input(false, title="Long Stop Loss", group="Stop Loss and Take Profit", inline="Long_SL")
long_stop_loss = input(title="(%)", type=input.float, minval=0.0, step=0.1,
     defval=5, group="Stop Loss and Take Profit", inline="Long_SL") * 0.01

//Take Profit Inputs
use_short_take_profit = input(false, title="Short Take Profit", group="Stop Loss and Take Profit", inline="Short_TP")
short_take_profit = input(title="(%)", type=input.float, minval=0.0, step=0.1,
     defval = 20, group="Stop Loss and Take Profit", inline="Short_TP") * .01
use_long_take_profit = input(false, title="Long Take Profit", group="Stop Loss and Take Profit", inline="Long_TP")
long_take_profit = input(title="(%)", type=input.float, minval=0.0, step=0.1,
     defval = 20, group="Stop Loss and Take Profit", inline="Long_TP") * .01


longStopPrice  = strategy.position_avg_price * (1 - long_stop_loss)
shortStopPrice = strategy.position_avg_price * (1 + short_stop_loss)
longLimitPrice = strategy.position_avg_price * (1 + long_take_profit)
shortLimitPrice = strategy.position_avg_price * (1 - short_take_profit)


if (strategy.position_size > 0.0)
    if (use_long_stop_loss and not use_long_take_profit)
        strategy.exit("Long", stop = longStopPrice)
    if (use_long_take_profit and not use_long_stop_loss)
        strategy.exit("Long", limit = longLimitPrice)
    if (use_long_take_profit and use_long_stop_loss)
        strategy.exit("Long", stop = longStopPrice, limit=longLimitPrice)
if (strategy.position_size < 0.0)
    if (use_short_stop_loss and not use_short_take_profit)
        strategy.exit("Short", stop = shortStopPrice)
    if (use_short_take_profit and not use_short_stop_loss)
        strategy.exit("Short", limit = shortLimitPrice)
    if (use_short_take_profit and use_short_stop_loss)
        strategy.exit("Short", stop = shortStopPrice, limit = shortLimitPrice)

//plot(strategy.equity, title="equity", color=color.red, linewidth=2, style=plot.style_areabr)