概述
RWI波动率反转策略通过计算一定周期内的RWI高点和RWI低点,判断市场是否处于反转状态,以发现反转机会,采用反转策略,在高位开空头,低位开多头,以期获利。
策略原理
该策略首先计算一定长度周期(如14根K线)内的RWI高点和RWI低点。RWI高低点的计算公式如下:
RWI高点=(高点-N周期前的最低点)/(N周期的ATR* sqrt(N))
RWI低点=(N周期前的最高点-最低点)/(N周期的ATR* sqrt(N))
然后计算RWI高低点与阈值的差值,判断是否小于阈值(如1)。如果 RWI高低点都小于阈值,则判断市场处于震荡状态,这时不做任何操作。
如果RWI高点大于RWI低点超过阈值,则判断行情即将反转,此时可以考虑做空;如果RWI低点大于RWI高点超过阈值,则判断行情即将反转,此时可以考虑做多。这样,就构成了一个基于RWI指标判断市场反转状态的反转交易策略。
优势分析
RWI波动率反转策略具有以下优势:
- 使用RWI指标判断反转点精确,胜率较高
- 采用反转策略,适合市场震荡行情
- 策略思路清晰易懂,参数调整灵活
- 可配置长短两个周期判断,提高信号质量
风险分析
RWI波动率反转策略也存在以下风险:
- 反转信号可能出现假突破,从而产生损失
- 行情持续趋势时,反转信号更多,会招致损失
- RWI参数设置不当可能导致信号质量下降
- 波动率扩大时,RWI指标失效
为控制风险,可以适当调整RWI参数,配置过滤条件,限定反转范围等。
优化方向
RWI波动率反转策略还可以从以下几个方面进行优化:
- 增加双时间轴判断,配置长短周期RWI指标,提高信号质量
- 结合其他指标如KD、MACD等判断反转,避免假突破
- 配置止损策略,严格控制单笔损失
- 动态优化RWI参数,适应市场变化
- 优化仓位管理,根据市场状况加减仓
总结
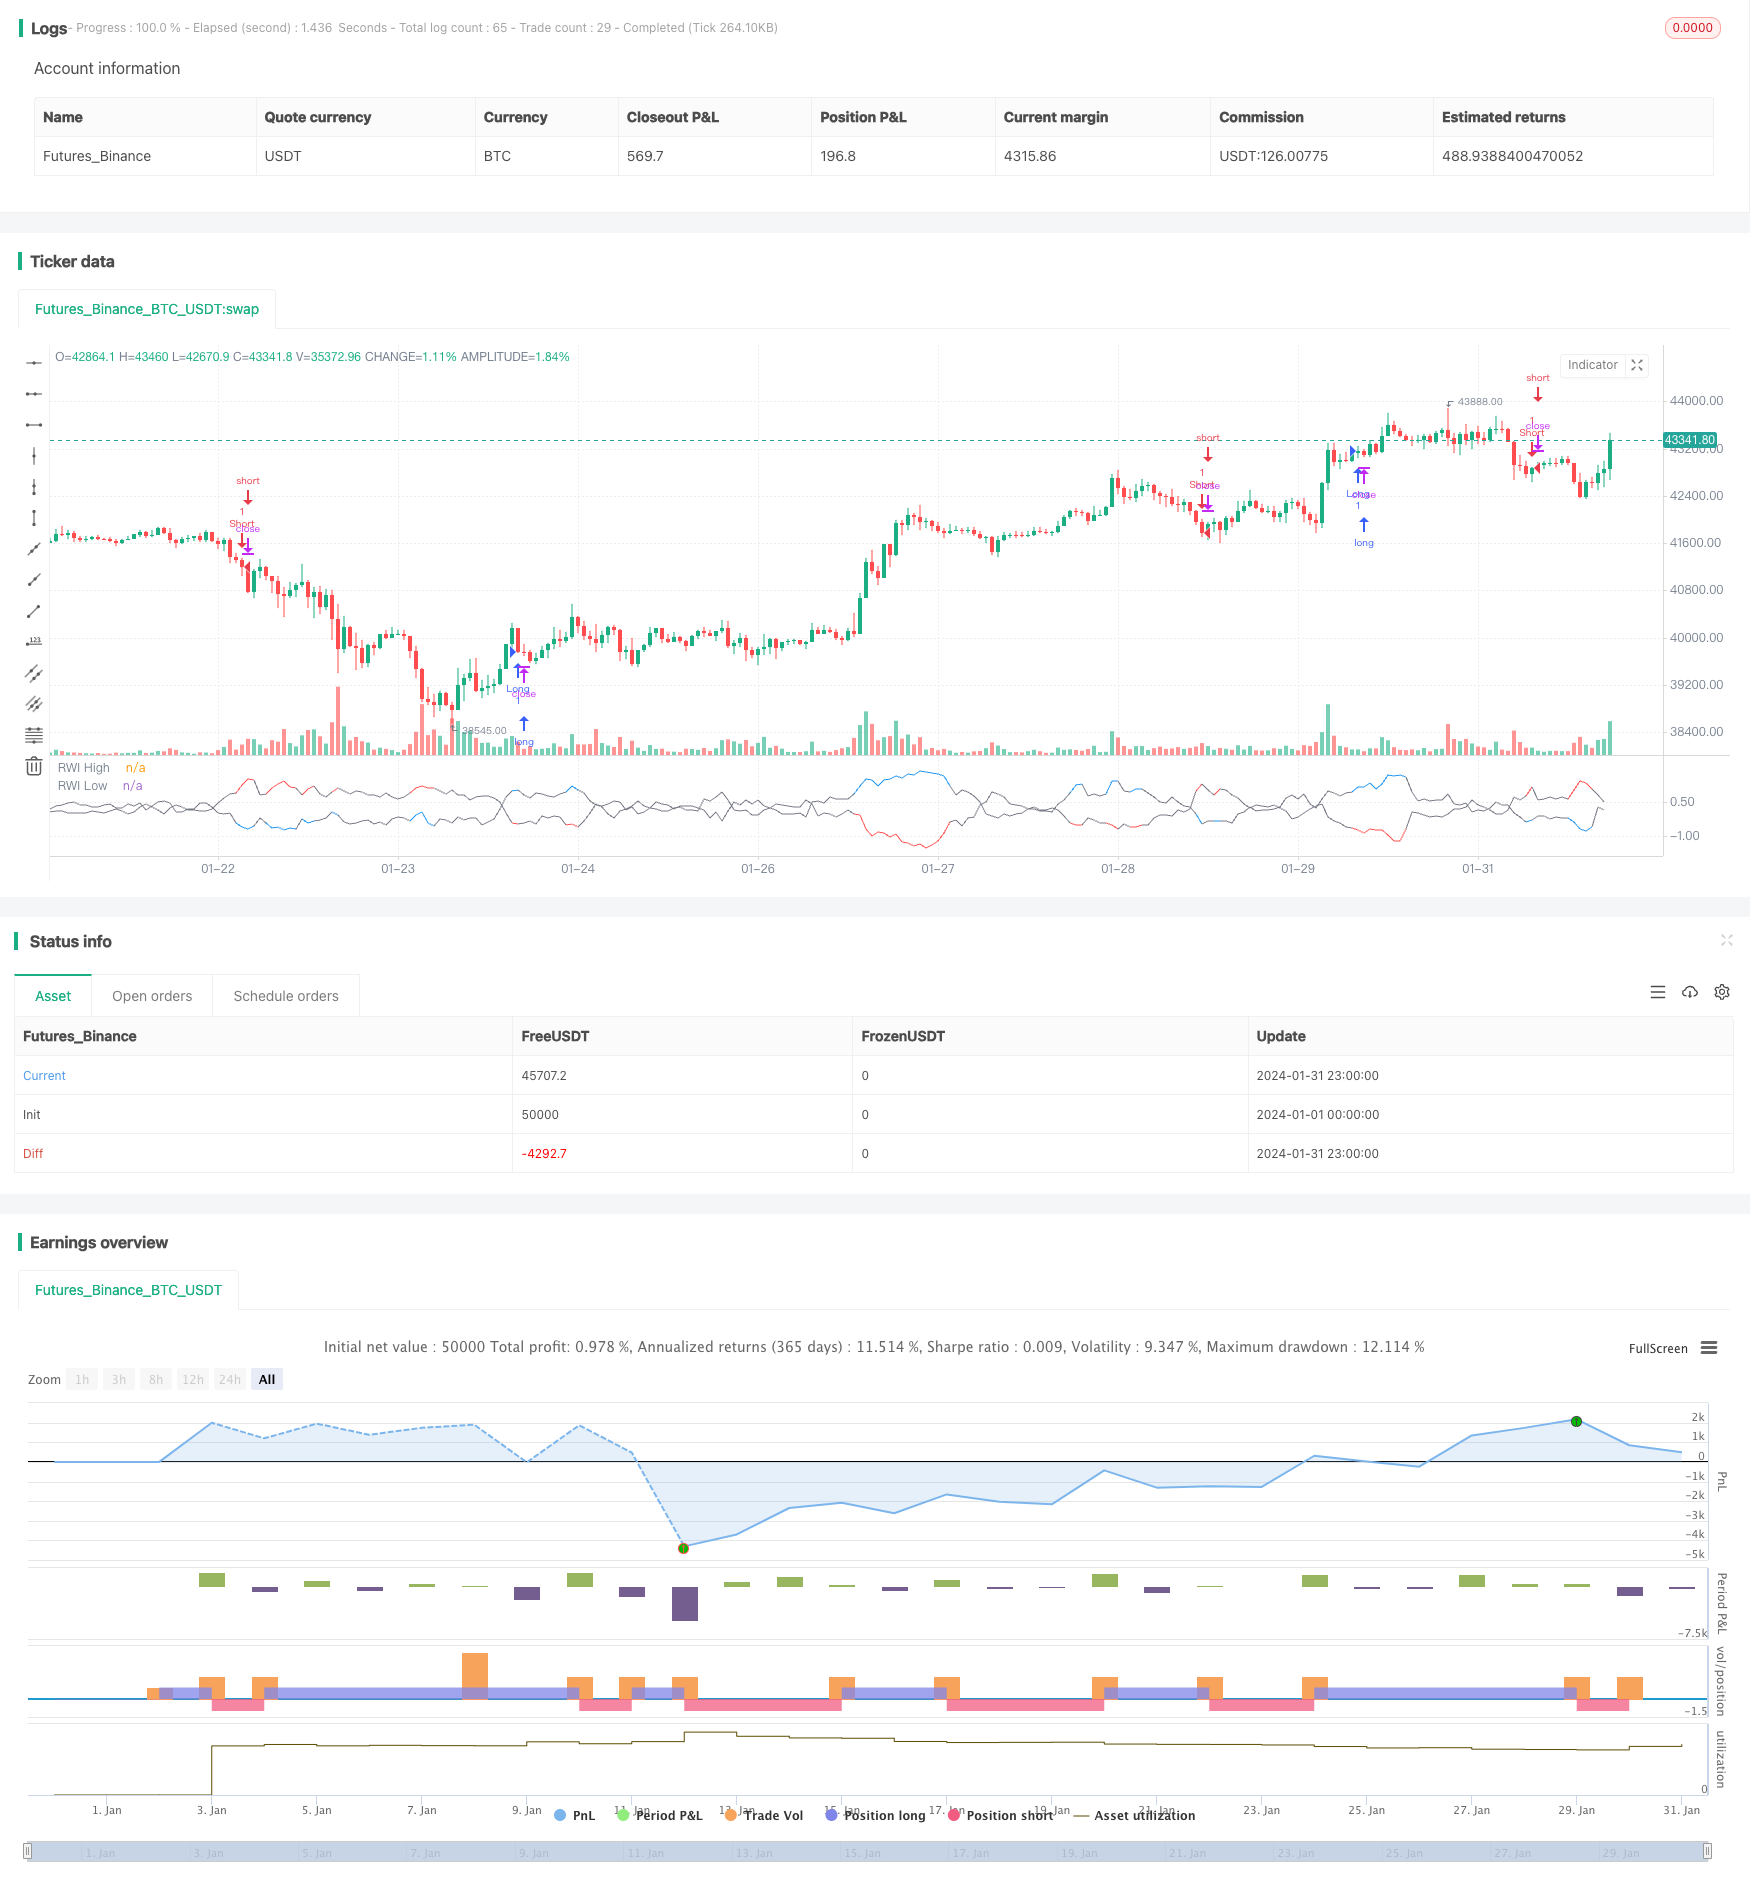
RWI波动率反转策略整体思路清晰,使用RWI指标判断反转时机,策略交易逻辑较好,在震荡盘整市场中效果较佳。通过参数优化、风险控制等手段,可以将该策略运用得更加稳定高效。
策略源码
/*backtest
start: 2024-01-01 00:00:00
end: 2024-01-31 23:59:59
period: 1h
basePeriod: 15m
exchanges: [{"eid":"Futures_Binance","currency":"BTC_USDT"}]
*/

//@version=4
// Copyright (c) 2020-present, JMOZ (1337.ltd)
strategy("RWI Strategy", overlay=false)


length = input(title="Length", type=input.integer, defval=14, minval=1)
threshold = input(title="Threshold", type=input.float, defval=1.0, step=0.1)


rwi(length, threshold) =>
    rwi_high = (high - nz(low[length])) / (atr(length) * sqrt(length))
    rwi_low = (nz(high[length]) - low) / (atr(length) * sqrt(length))
    is_rw = rwi_high < threshold and rwi_low < threshold
    [is_rw, rwi_high, rwi_low]


[is_rw, rwi_high, rwi_low] = rwi(length, threshold)


long = not is_rw and rwi_high > rwi_low
short = not is_rw and rwi_low > rwi_high


strategy.entry("Long", strategy.long, when=long)
strategy.entry("Short", strategy.short, when=short)


plot(rwi_high, title="RWI High", linewidth=1, color=is_rw?color.gray:color.blue, transp=0)
plot(rwi_low, title="RWI Low", linewidth=1, color=is_rw?color.gray:color.red, transp=0)