概述
本策略基于两个移动平均线的交叉形成买入和卖出信号的思路。通过自定义快线和慢线的均线长度,在快线上穿慢线时产生买入信号,快线下穿慢线时产生卖出信号,以捕捉趋势的变化。
策略原理
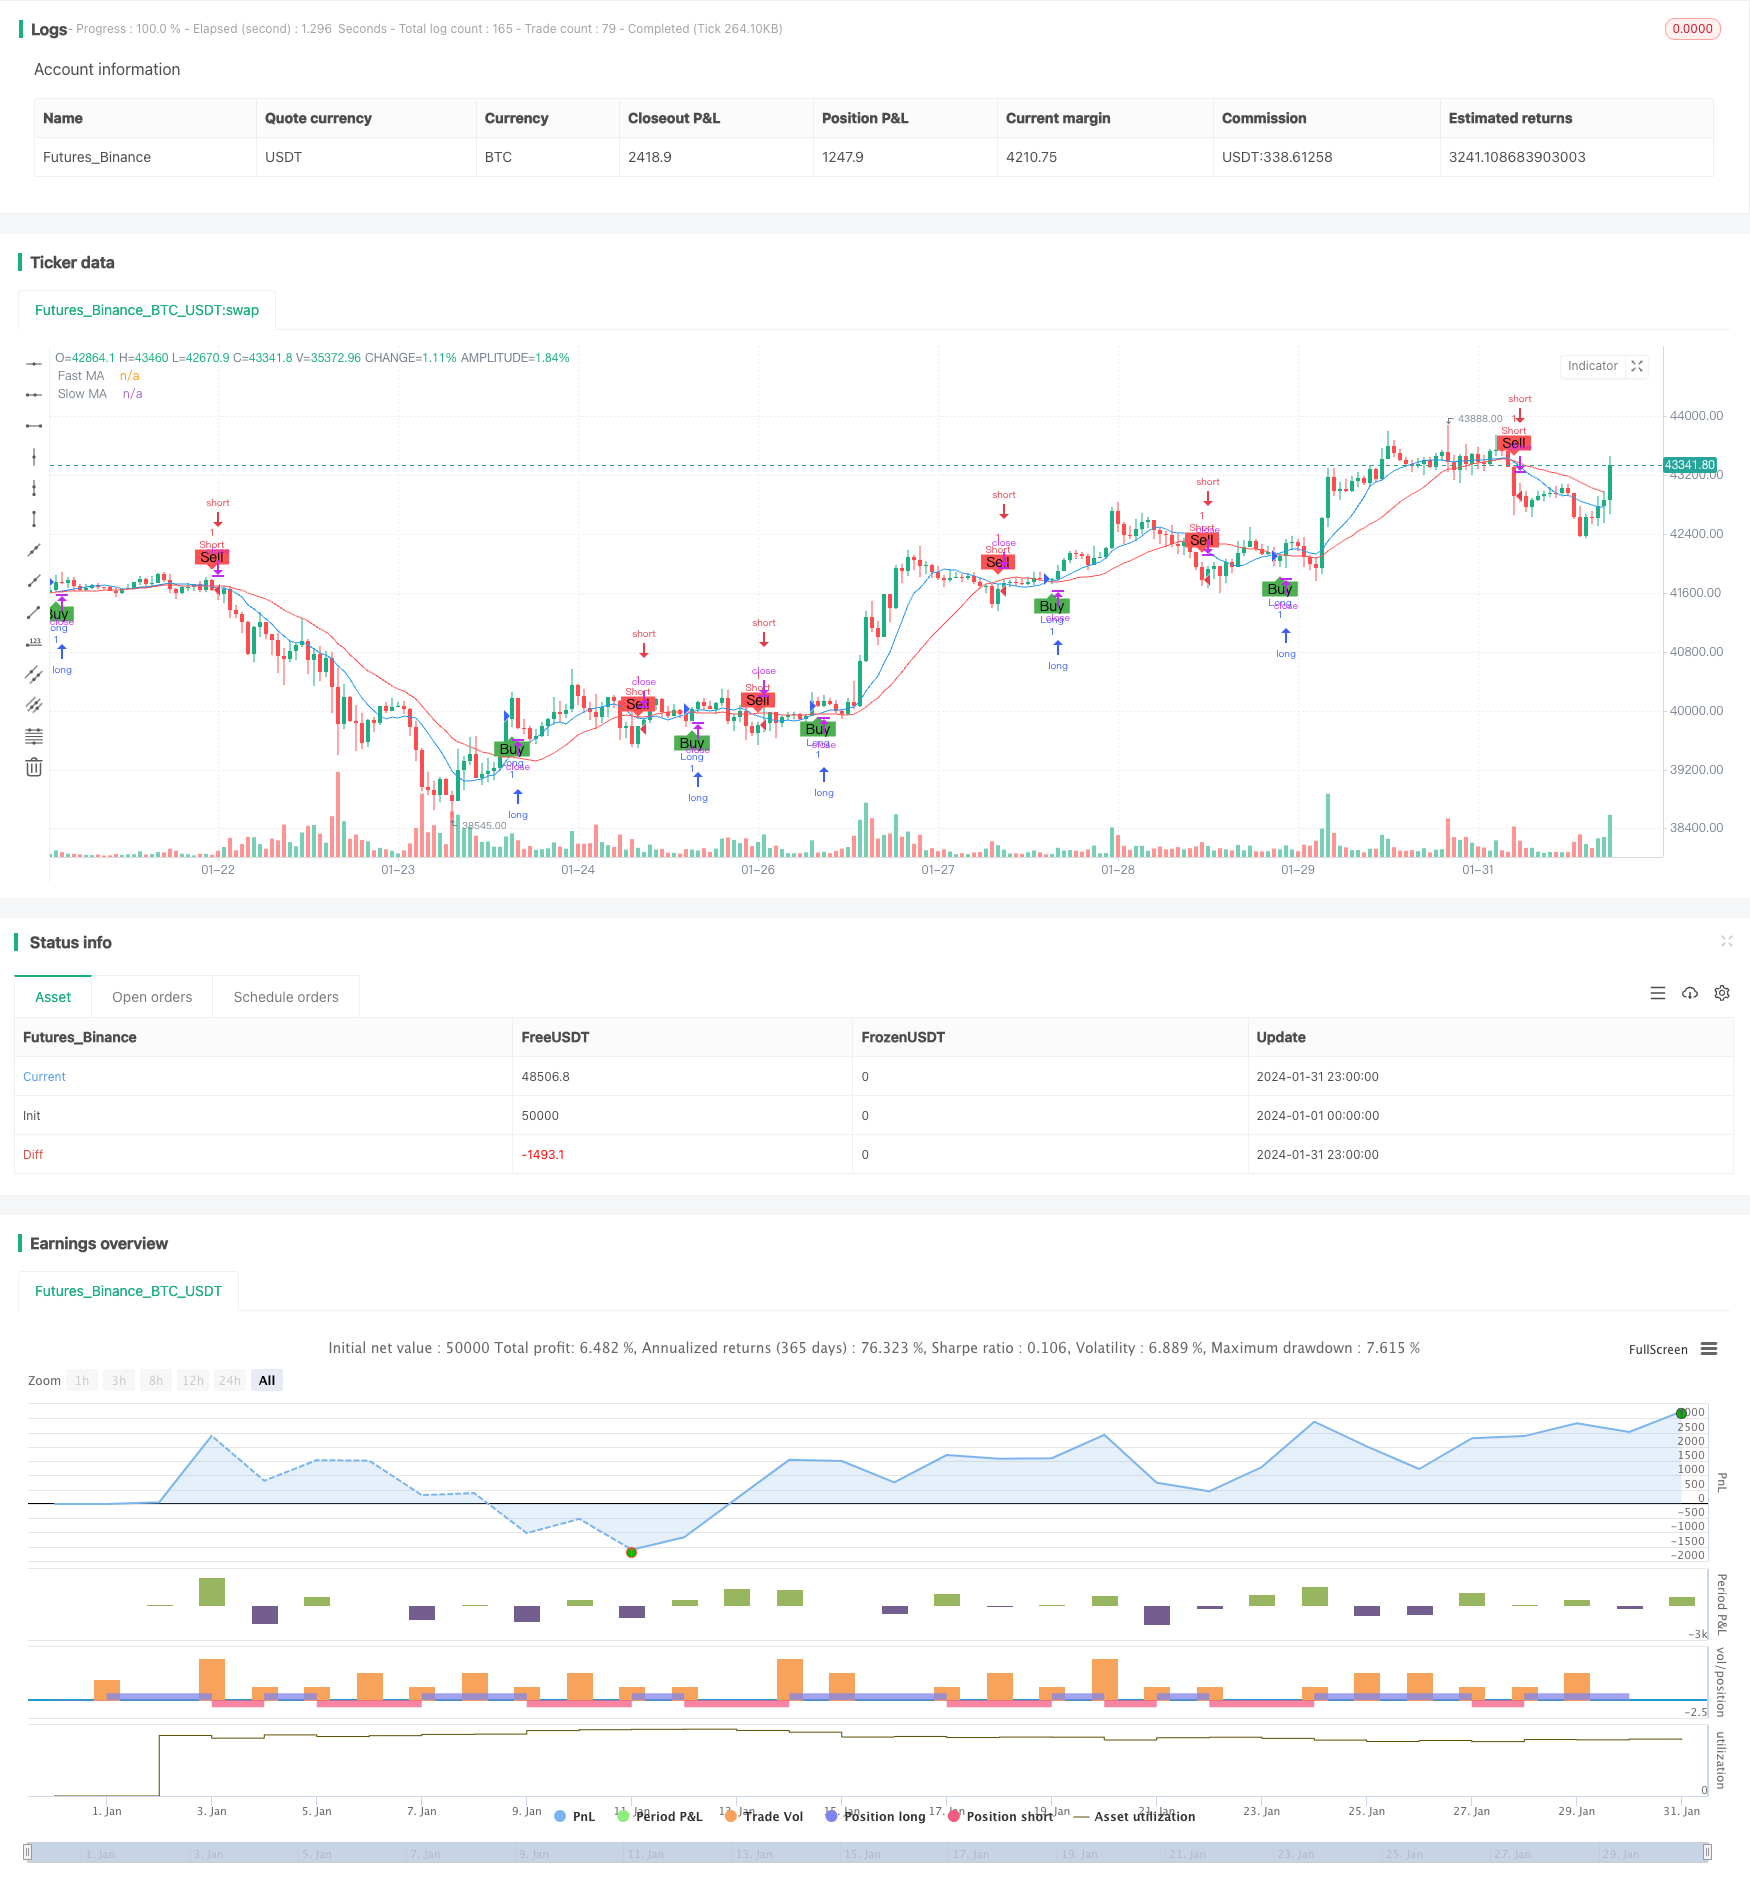
该策略使用两个移动平均线,包括一条快速移动平均线(蓝线)和一条慢速移动平均线(红线)。这两条移动平均线的长度是可以通过Pine Script的输入参数进行自定义的。
当快速移动平均线从下方上穿越慢速移动平均线时,会产生买入信号(呈现绿色箭头和“Buy”的标签)。这被视为看涨信号,表示潜在的上升趋势。
当快速移动平均线从上方下穿越慢速移动平均线时,会产生卖出信号(呈现红色箭头和“Sell”的标签)。这被视为看跌信号,表示潜在的下降趋势。
该策略使用strategy.entry函数根据买入和卖出信号来执行交易。当出现买入信号时(longCondition为真),使用strategy.entrySUBMITTED功能开启多头仓位。当出现卖出信号时(shortCondition为真),使用strategy.entrySUBMITTED功能开启空头仓位。
为了在图表上可视化买入和卖出信号,该策略使用了plotshape函数来绘制箭头。绿色箭头和“Buy”标签表示买入信号,红色箭头和“Sell”标签表示卖出信号。
优势分析
该双均线交叉策略具有以下优势:
- 规则简单明确,容易理解实施
- 可以有效跟踪趋势的变化,及时捕捉买卖点
- 通过调整均线长度参数可以适应不同行情
- 容易与其他技术指标组合,构建复合策略
风险分析
该策略也存在以下风险:
- 在震荡行情中容易产生假信号
- 没有考虑止损因素,可能带来较大亏损
- 买卖点容易被其他使用同样策略的交易者捷足先登
可以通过以下方法降低风险:
- 结合其他指标过滤假信号
- 增加移动止损来控制风险
- 调整移动平均线的参数优化策略
优化方向
该策略可以从以下几个方向进行优化:
- 增加数量型指标作为过滤信号,如成交量平均线等
- 增加止损策略管理风险,如移动止损、阵列止损等
- 对买卖点进行评级,设置不同的参数组合
- 优化移动平均线的长度参数
- 增加机器学习等更复杂技术提高策略效果
通过多方位优化,可以进一步增强该策略的稳定性和盈利能力。
总结
本策略作为一个基于移动平均线交叉的简单趋势跟踪策略,规则简单清晰,容易实施和回测,可以快速判断市场的涨跌趋势。同时也要注意防范潜在的风险,并在实盘中与其他技术指标和风险管理手段配合使用,从而全面提高策略的稳定性和盈利空间。通过不断优化完善,本策略具有很强的实用性。
/*backtest
start: 2024-01-01 00:00:00
end: 2024-01-31 23:59:59
period: 1h
basePeriod: 15m
exchanges: [{"eid":"Futures_Binance","currency":"BTC_USDT"}]
*/

//@version=4
strategy("Moving Average Crossover", overlay=true)

// Input parameters
fastLength = input(9, title="Fast MA Length")
slowLength = input(21, title="Slow MA Length")
src = close

// Calculate moving averages
fastMA = sma(src, fastLength)
slowMA = sma(src, slowLength)

// Plot moving averages on the chart
plot(fastMA, color=color.blue, title="Fast MA")
plot(slowMA, color=color.red, title="Slow MA")

// Strategy logic
longCondition = crossover(fastMA, slowMA)
shortCondition = crossunder(fastMA, slowMA)

// Execute strategy
strategy.entry("Long", strategy.long, when=longCondition)
strategy.entry("Short", strategy.short, when=shortCondition)

// Plot buy and sell signals on the chart
plotshape(series=longCondition, title="Buy Signal", color=color.green, style=shape.labelup, text="Buy", location=location.belowbar)
plotshape(series=shortCondition, title="Sell Signal", color=color.red, style=shape.labeldown, text="Sell", location=location.abovebar)