概述
该策略的核心是基于安德鲁·亚伯拉罕在1998年9月《交易趋势》杂志TASC专栏中发表的文章中开发的指标。该指标利用平均真实波动范围和价格通道判断市场趋势方向,结合MACD指标进行交易信号过滤,旨在捕捉中长线趋势。
策略原理
该策略首先计算21日平均真实波动范围(ATR)的加权移动平均作为基准波动范围。然后计算过去21日的最高价和最低价,以当前K线收盘价与基准波动范围上下限进行比较,判断价格是否突破通道,从而判断趋势方向。
具体来说,定义通道上限为过去21日最高价减去3倍基准ATR,通道下限为过去21日最低价加上3倍基准ATR。当收盘价高于通道上限时,判断为看涨趋势;当收盘价低于通道下限时,判断为看跌趋势。
在判定趋势方向的同时,该策略还引入MACD指标进行过滤。只有当MACD柱状线为正时才产生买入信号,避免错过买点。
策略优势
该策略结合趋势判断和指标过滤,能有效判断市场中长线趋势方向,避免被市场短期波动误导。具体优势如下:
- 使用价格通道判断趋势,准确判定长线趋势方向
- 基准波动范围能动态调整,适应市场变化
- MACD指标过滤增加决策依据,避免错失买点
- 可配置参数,灵活调整策略风格
策略风险
该策略也存在一定风险,主要体现在以下几个方面:
- 价格通道范围无法完全避免被突破的风险
- MACD指标可能产生误导 signal的风险
- Parameters设置不当可能导致strategy不稳定
对此,可通过优化参数设置、严格 position sizing、及时止损来降低风险。
策略优化方向
该策略主要可从以下几个方面进行优化:
1.测试不同参数组合,寻找最佳parameter
可以测试不同的Length parameter或Multiplier parameter的组合,找到基于回测数据产生最佳收益率的parameter组合。
2.结合其他指标过滤signal
可测试结合RSI, KDJ等其他指标来过滤signal,看是否可以提高收益率。
3.动态调整参数
可以根据市场情况来动态调整parameter,比如在趋势明显时适当放宽通道范围,在震荡时适当收紧通道范围。
总结
该策略整体来说是一种相对稳健的趋势追踪策略。它结合价格通道判定趋势方向和MACD指标过滤信号的方法,可以有效判断市场中长线趋势,产生稳定收益。通过参数优化、风险管理和适当修正,该策略可以成为量化交易体系中的重要组成部分。
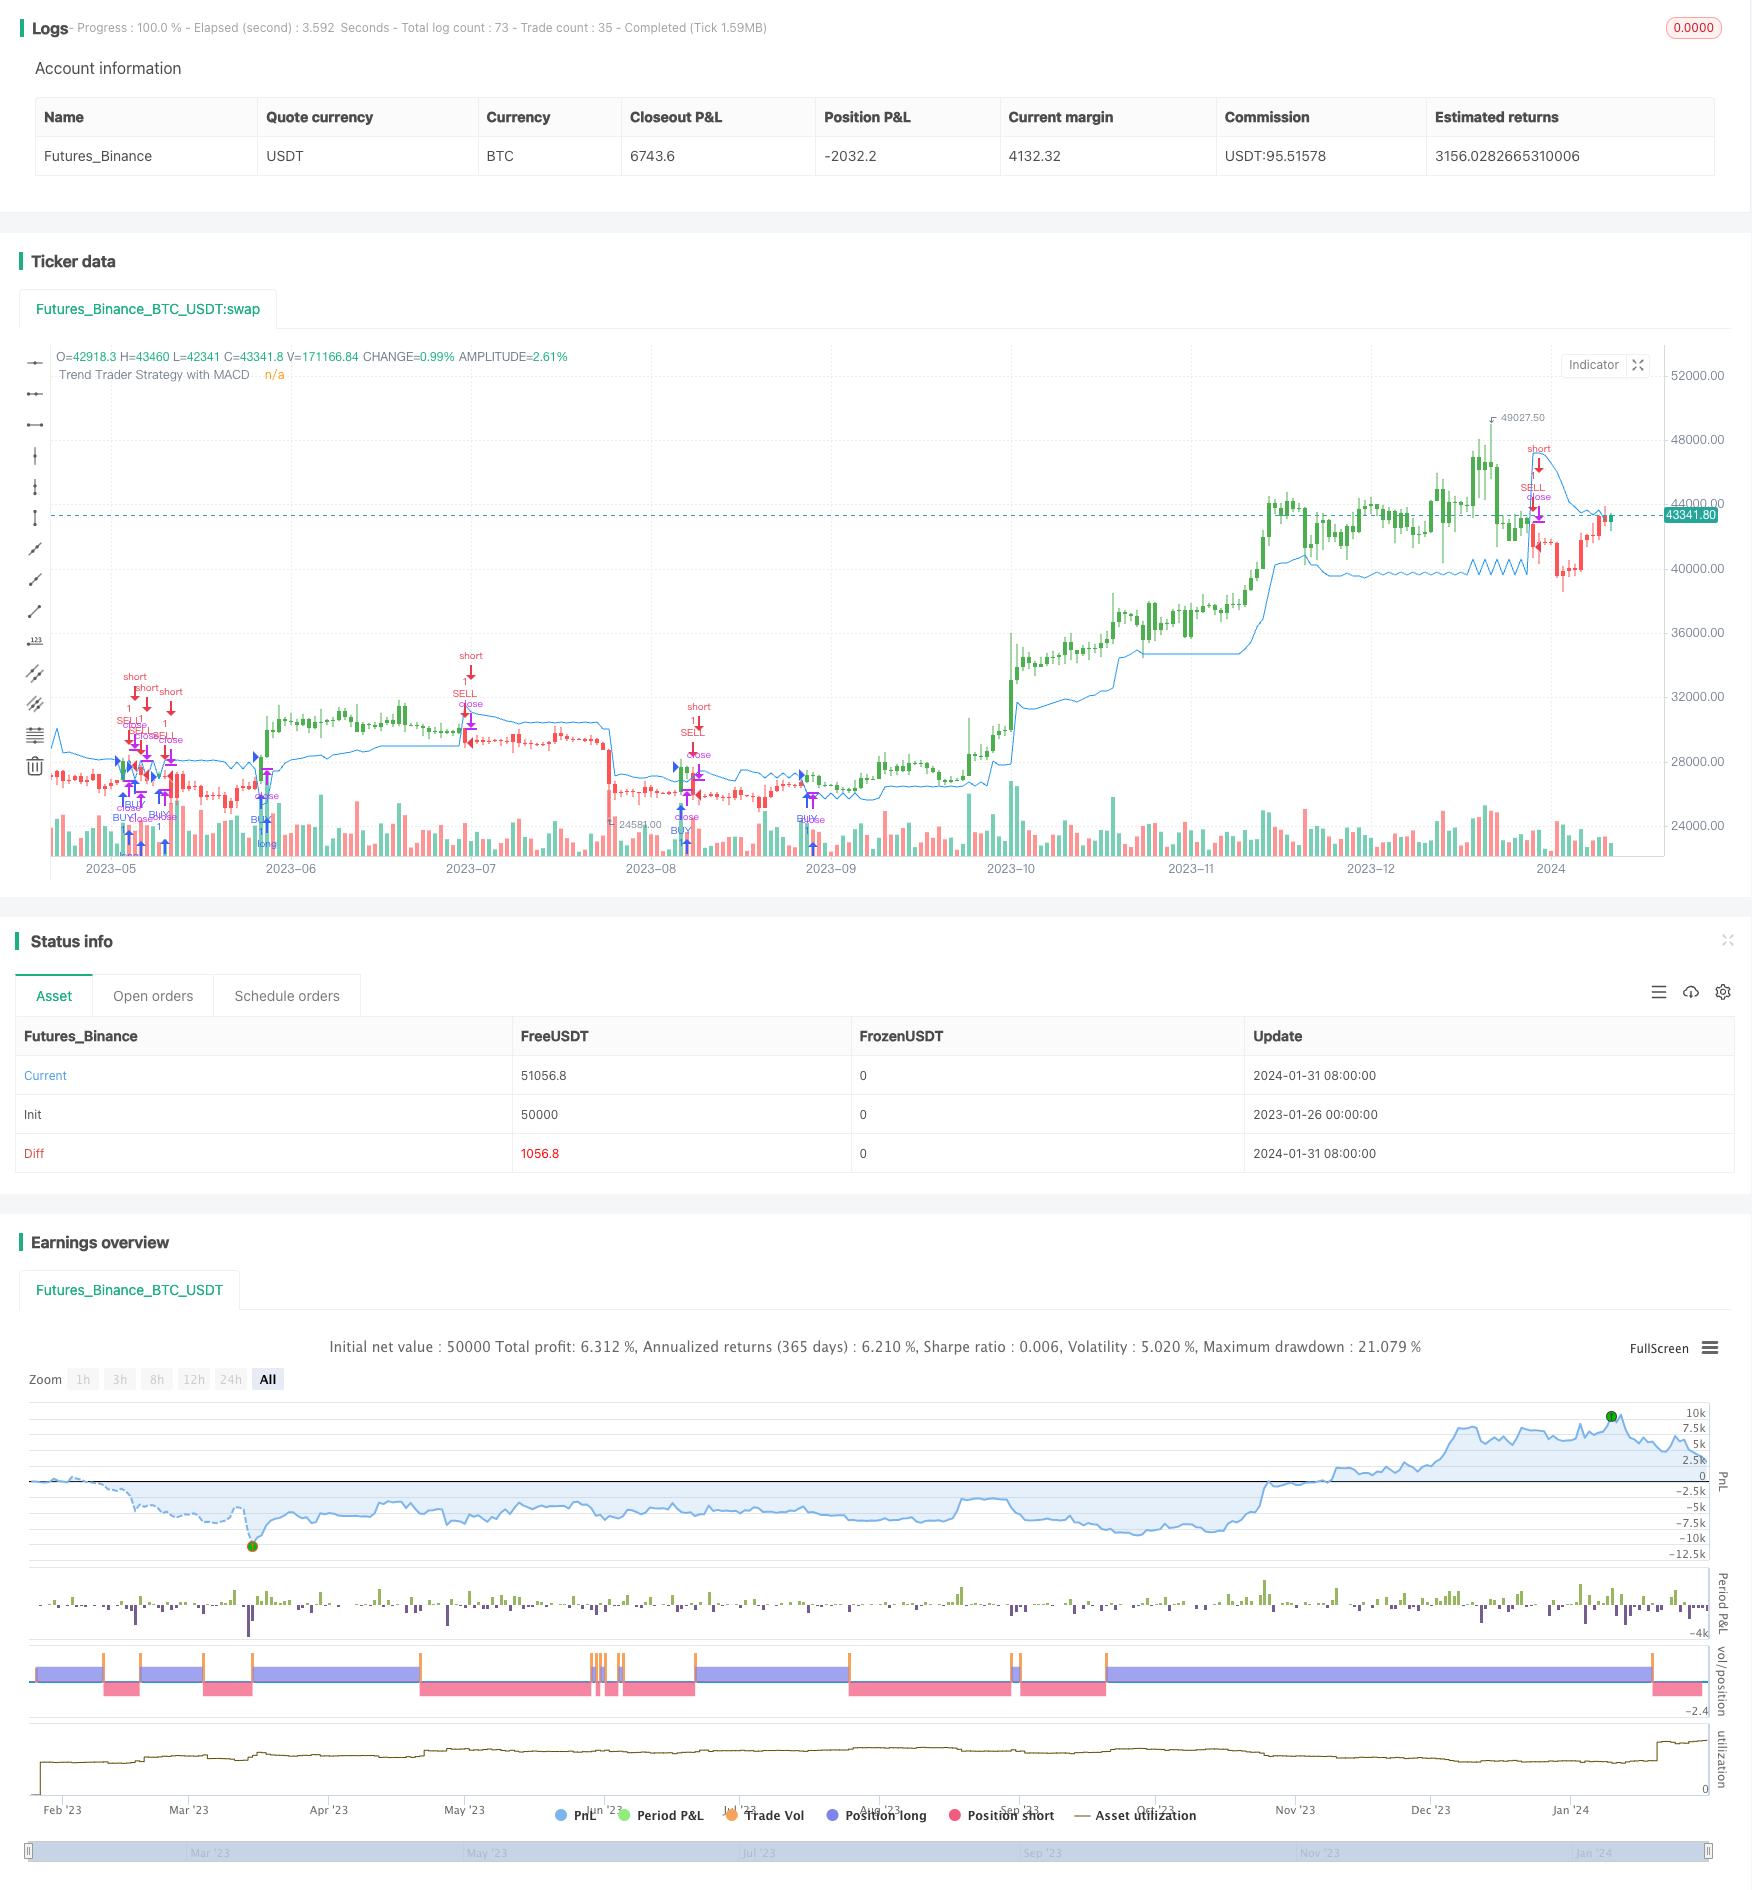
/*backtest
start: 2023-01-26 00:00:00
end: 2024-02-01 00:00:00
period: 1d
basePeriod: 1h
exchanges: [{"eid":"Futures_Binance","currency":"BTC_USDT"}]
*/

// This source code is subject to the terms of the Mozilla Public License 2.0 at https://mozilla.org/MPL/2.0/
// © melihtuna

//@version=1
strategy("Trend Trader Strategy with MACD", overlay=true)

// === Trend Trader Strategy ===
Length = input(21),
Multiplier = input(3, minval=1)
MacdControl = input(true, title="Control 'MACD Histogram is positive?' when Buy condition")
avgTR      = wma(atr(1), Length)
highestC   = highest(Length)
lowestC    = lowest(Length)
hiLimit = highestC[1]-(avgTR[1] * Multiplier)
loLimit = lowestC[1]+(avgTR[1] * Multiplier)
ret = iff(close > hiLimit and close > loLimit, hiLimit,
        iff(close < loLimit and close < hiLimit, loLimit, nz(ret[1], 0)))
pos =	iff(close > ret, 1,
	    iff(close < ret, -1, nz(pos[1], 0)))
barcolor(pos == -1 ? red: pos == 1 ? green : blue )
plot(ret, color= blue , title="Trend Trader Strategy with MACD")

// === INPUT BACKTEST RANGE ===
FromMonth = input(defval = 1, title = "From Month", minval = 1, maxval = 12)
FromDay   = input(defval = 1, title = "From Day", minval = 1, maxval = 31)
FromYear  = input(defval = 2020, title = "From Year", minval = 2017)
ToMonth   = input(defval = 1, title = "To Month", minval = 1, maxval = 12)
ToDay     = input(defval = 1, title = "To Day", minval = 1, maxval = 31)
ToYear    = input(defval = 9999, title = "To Year", minval = 2017)

// === FUNCTION EXAMPLE ===
start     = timestamp(FromYear, FromMonth, FromDay, 00, 00)  // backtest start window
finish    = timestamp(ToYear, ToMonth, ToDay, 23, 59)        // backtest finish window
window()  => true

// === MACD ===
[macdLine, signalLine, histLine] = macd(close, 12, 26, 9)
macdCond= MacdControl ? histLine[0] > 0 ? true : false : true

strategy.entry("BUY", strategy.long, when = window() and pos == 1 and macdCond)
strategy.entry("SELL", strategy.short, when = window() and pos == -1)