概述
本策略运用50周期平滑移动平均线(SMMA)和20周期简单移动平均线(SMA)的交叉信号来判断买入和卖出时机。当快线SMA向上突破慢线SMMA时产生买入信号;当SMA向下跌破SMMA时产生卖出信号。同时,策略preset了固定止盈位和动态止损位来锁定利润和控制风险。
策略原理
- 计算并绘制50周期SMMA和20周期SMA。
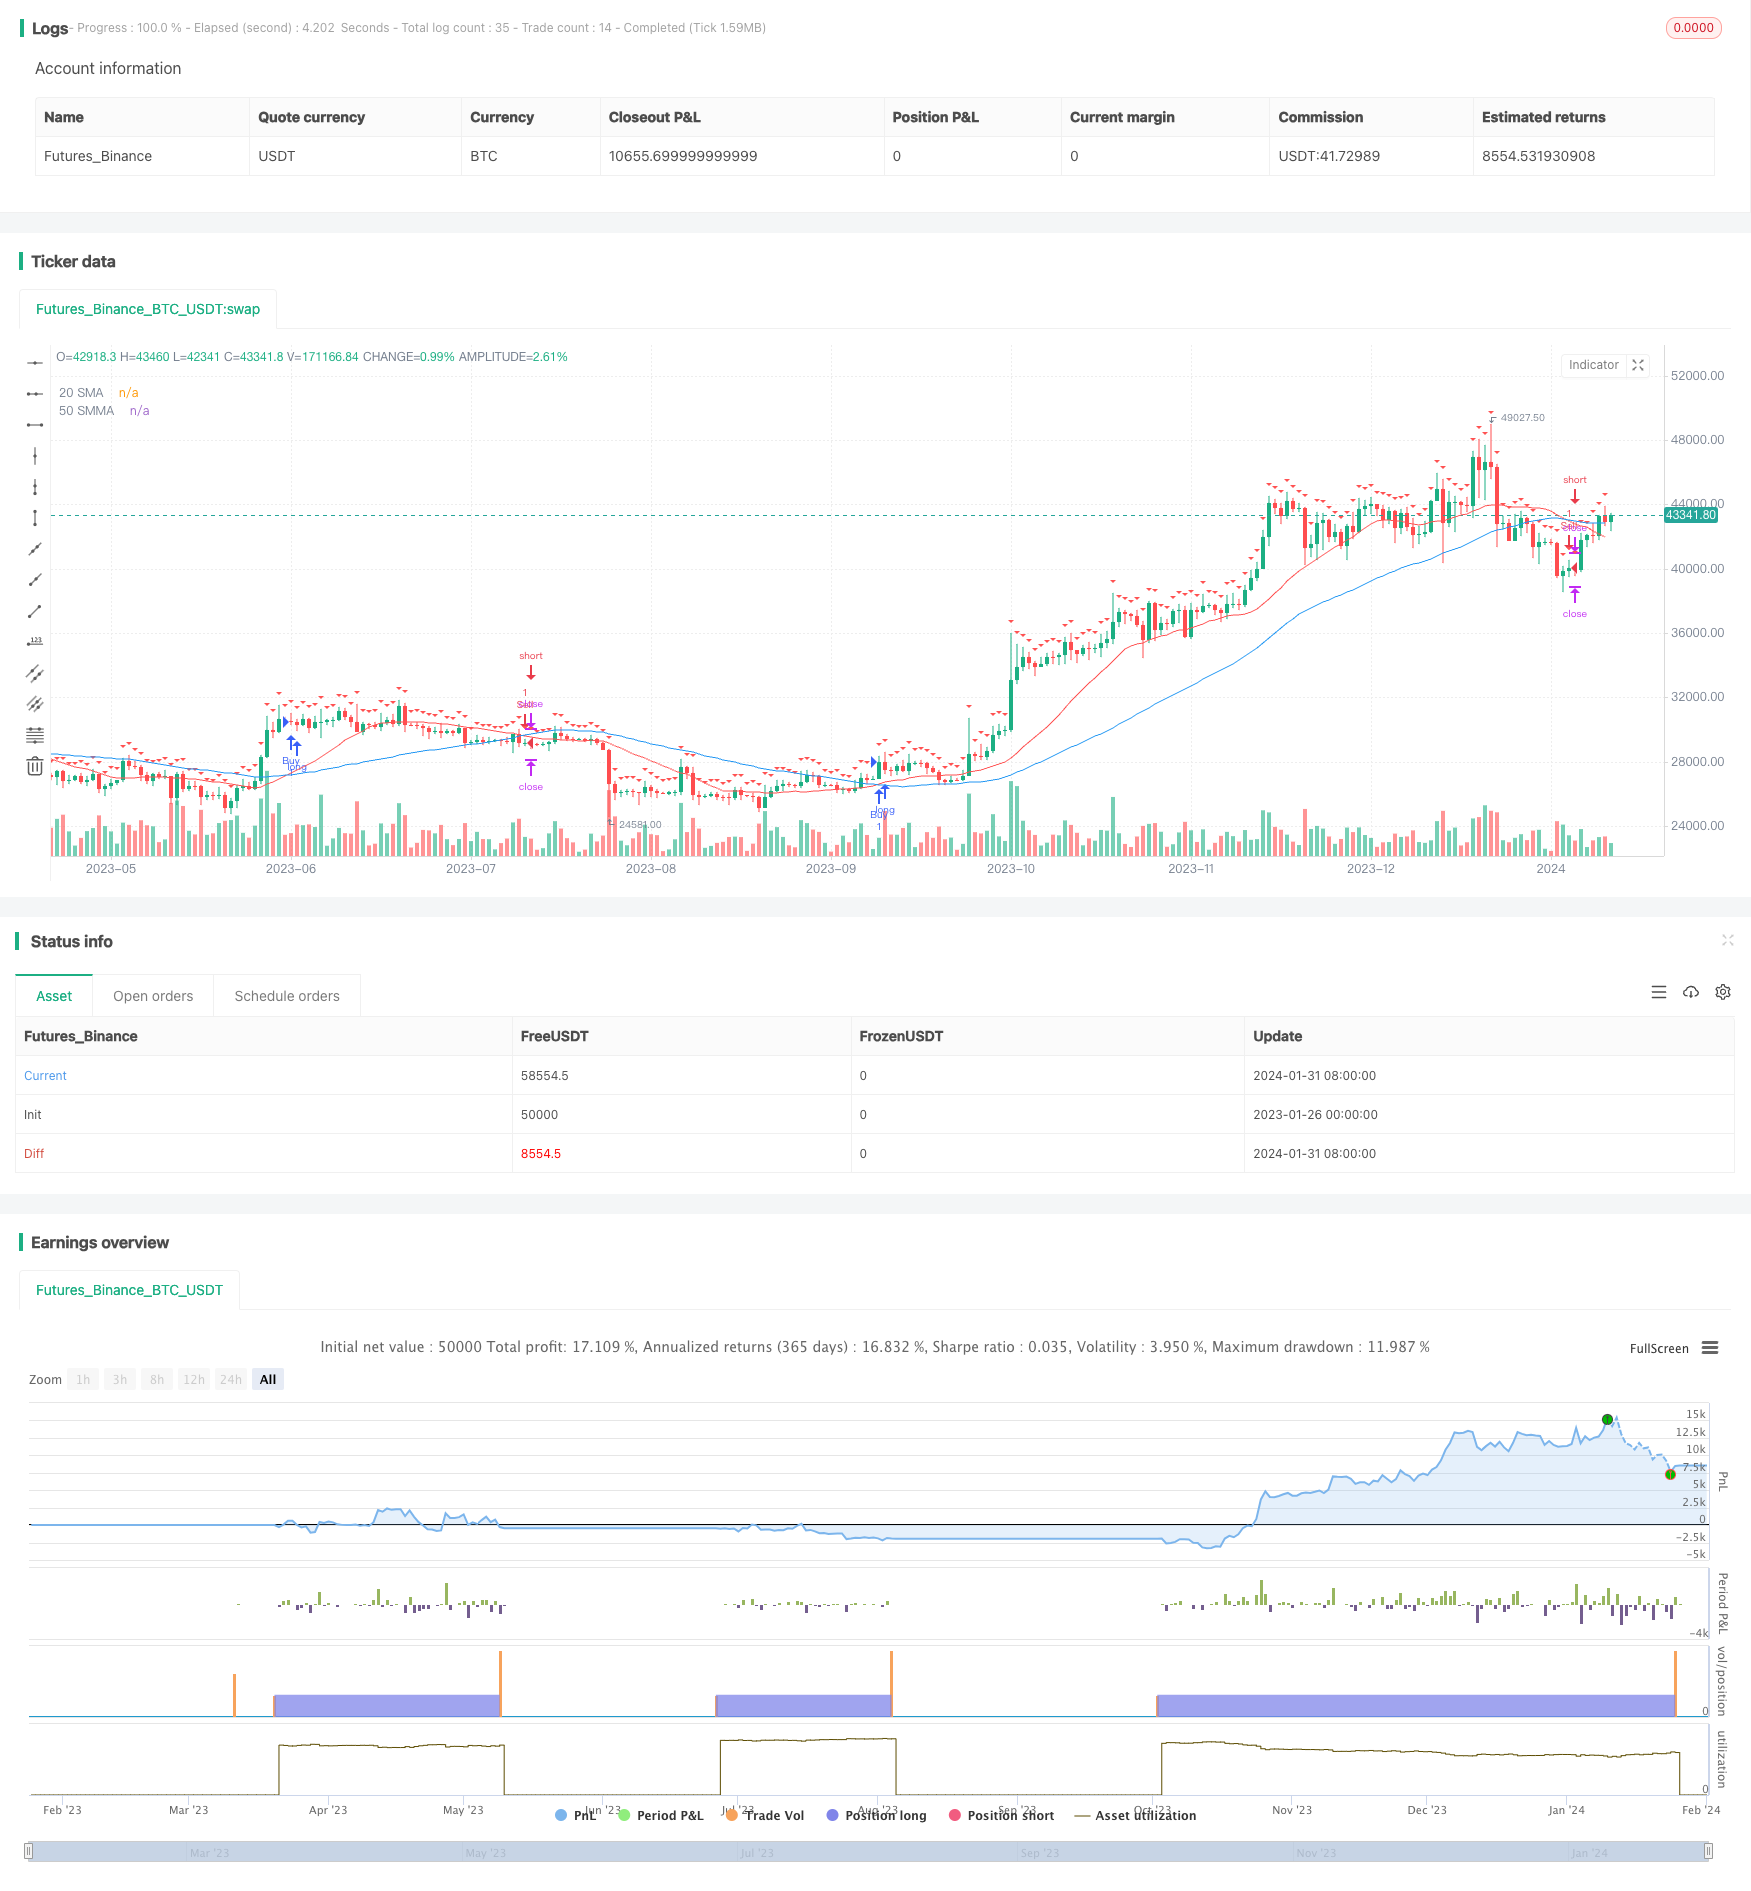
- 当SMA从下向上突破SMMA时,产生买入信号;相反,SMA从上向下突破SMMA时,产生卖出信号。
- 在买入和卖出信号发生时,分别建立”Buy”和”Sell”的仓位。
- 为每个仓位设置了固定150个点的止盈位。
- 在产生信号的下一根K线收盘价设置动态止损位。
- 如果价格触碰止盈位,则止盈;如果触碰止损位,则止损。
优势分析
- 双均线策略容易操作,原理简单,容易理解。
- SMMA是对SMA的改进,能更好地抓住趋势。
- 结合不同周期的SMA和SMMA,可以在滤波震荡的同时捕捉趋势。
- 采用动态止损可以根据行情变化调整止损位置,有效控制风险。
- 预设止盈位有助于及时锁定利润。
风险分析
- 双均线策略容易产生虚假信号,被套利。可以适当过滤信号,避免过于频繁交易。
- 固定止盈易错过大行情。可以设定移动止盈或盈利比例止盈。
- 动态止损在行情剧烈波动时可能会过于靠近,应适当放宽止损幅度。
- 需注意不同品种和周期参数的差异性。
优化方向
1.可以测试不同参数(周期数、过滤条件等)的组合,寻找最佳参数;
2.可以结合其他因子过滤信号,例如成交量突增;
3.可以采用参数优化工具寻找最优参数;
可以考虑结合移动止盈、比例止盈等其他止盈方式;
可以结合市场波动率计算动态止损幅度。
总结
本策略整体运行简单,通过双均线捕捉趋势方向;灵活运用固定止盈和动态止损来锁定利润和控制风险,可谓风险和收益并重。本策略可进一步通过参数和规则优化来适应更广泛的市场环境。
策略源码
/*backtest
start: 2023-01-26 00:00:00
end: 2024-02-01 00:00:00
period: 1d
basePeriod: 1h
exchanges: [{"eid":"Futures_Binance","currency":"BTC_USDT"}]
*/

//@version=4
strategy("50 SMMA and 20 SMA Crossover with TP and SL", overlay=true)

// Define 50 SMMA
smma50 = sma(close, 50)

// Define 20 SMA
sma20 = sma(close, 20)

// Plotting the SMMA and SMA
plot(smma50, color=color.blue, title="50 SMMA")
plot(sma20, color=color.red, title="20 SMA")

// Initialize TP and SL variables
tp = 150
var float sl_price = na

// Buy Signal
buySignal = crossover(sma20, smma50)
strategy.entry("Buy", strategy.long, when = buySignal)
strategy.exit("Take Profit/Stop Loss", from_entry="Buy", profit=tp, loss=sl_price)

// Sell Signal
sellSignal = crossunder(sma20, smma50)
strategy.entry("Sell", strategy.short, when = sellSignal)
strategy.exit("Take Profit/Stop Loss", from_entry="Sell", profit=tp, loss=sl_price)

// Update stop loss level on every crossover
if (buySignal or sellSignal)
    sl_price := close[bar_index + 1]

// Plot Stop Loss level
plotshape(series=sl_price != na, title="Stop Loss Level", location=location.abovebar, color=color.red, style=shape.triangledown, size=size.small)