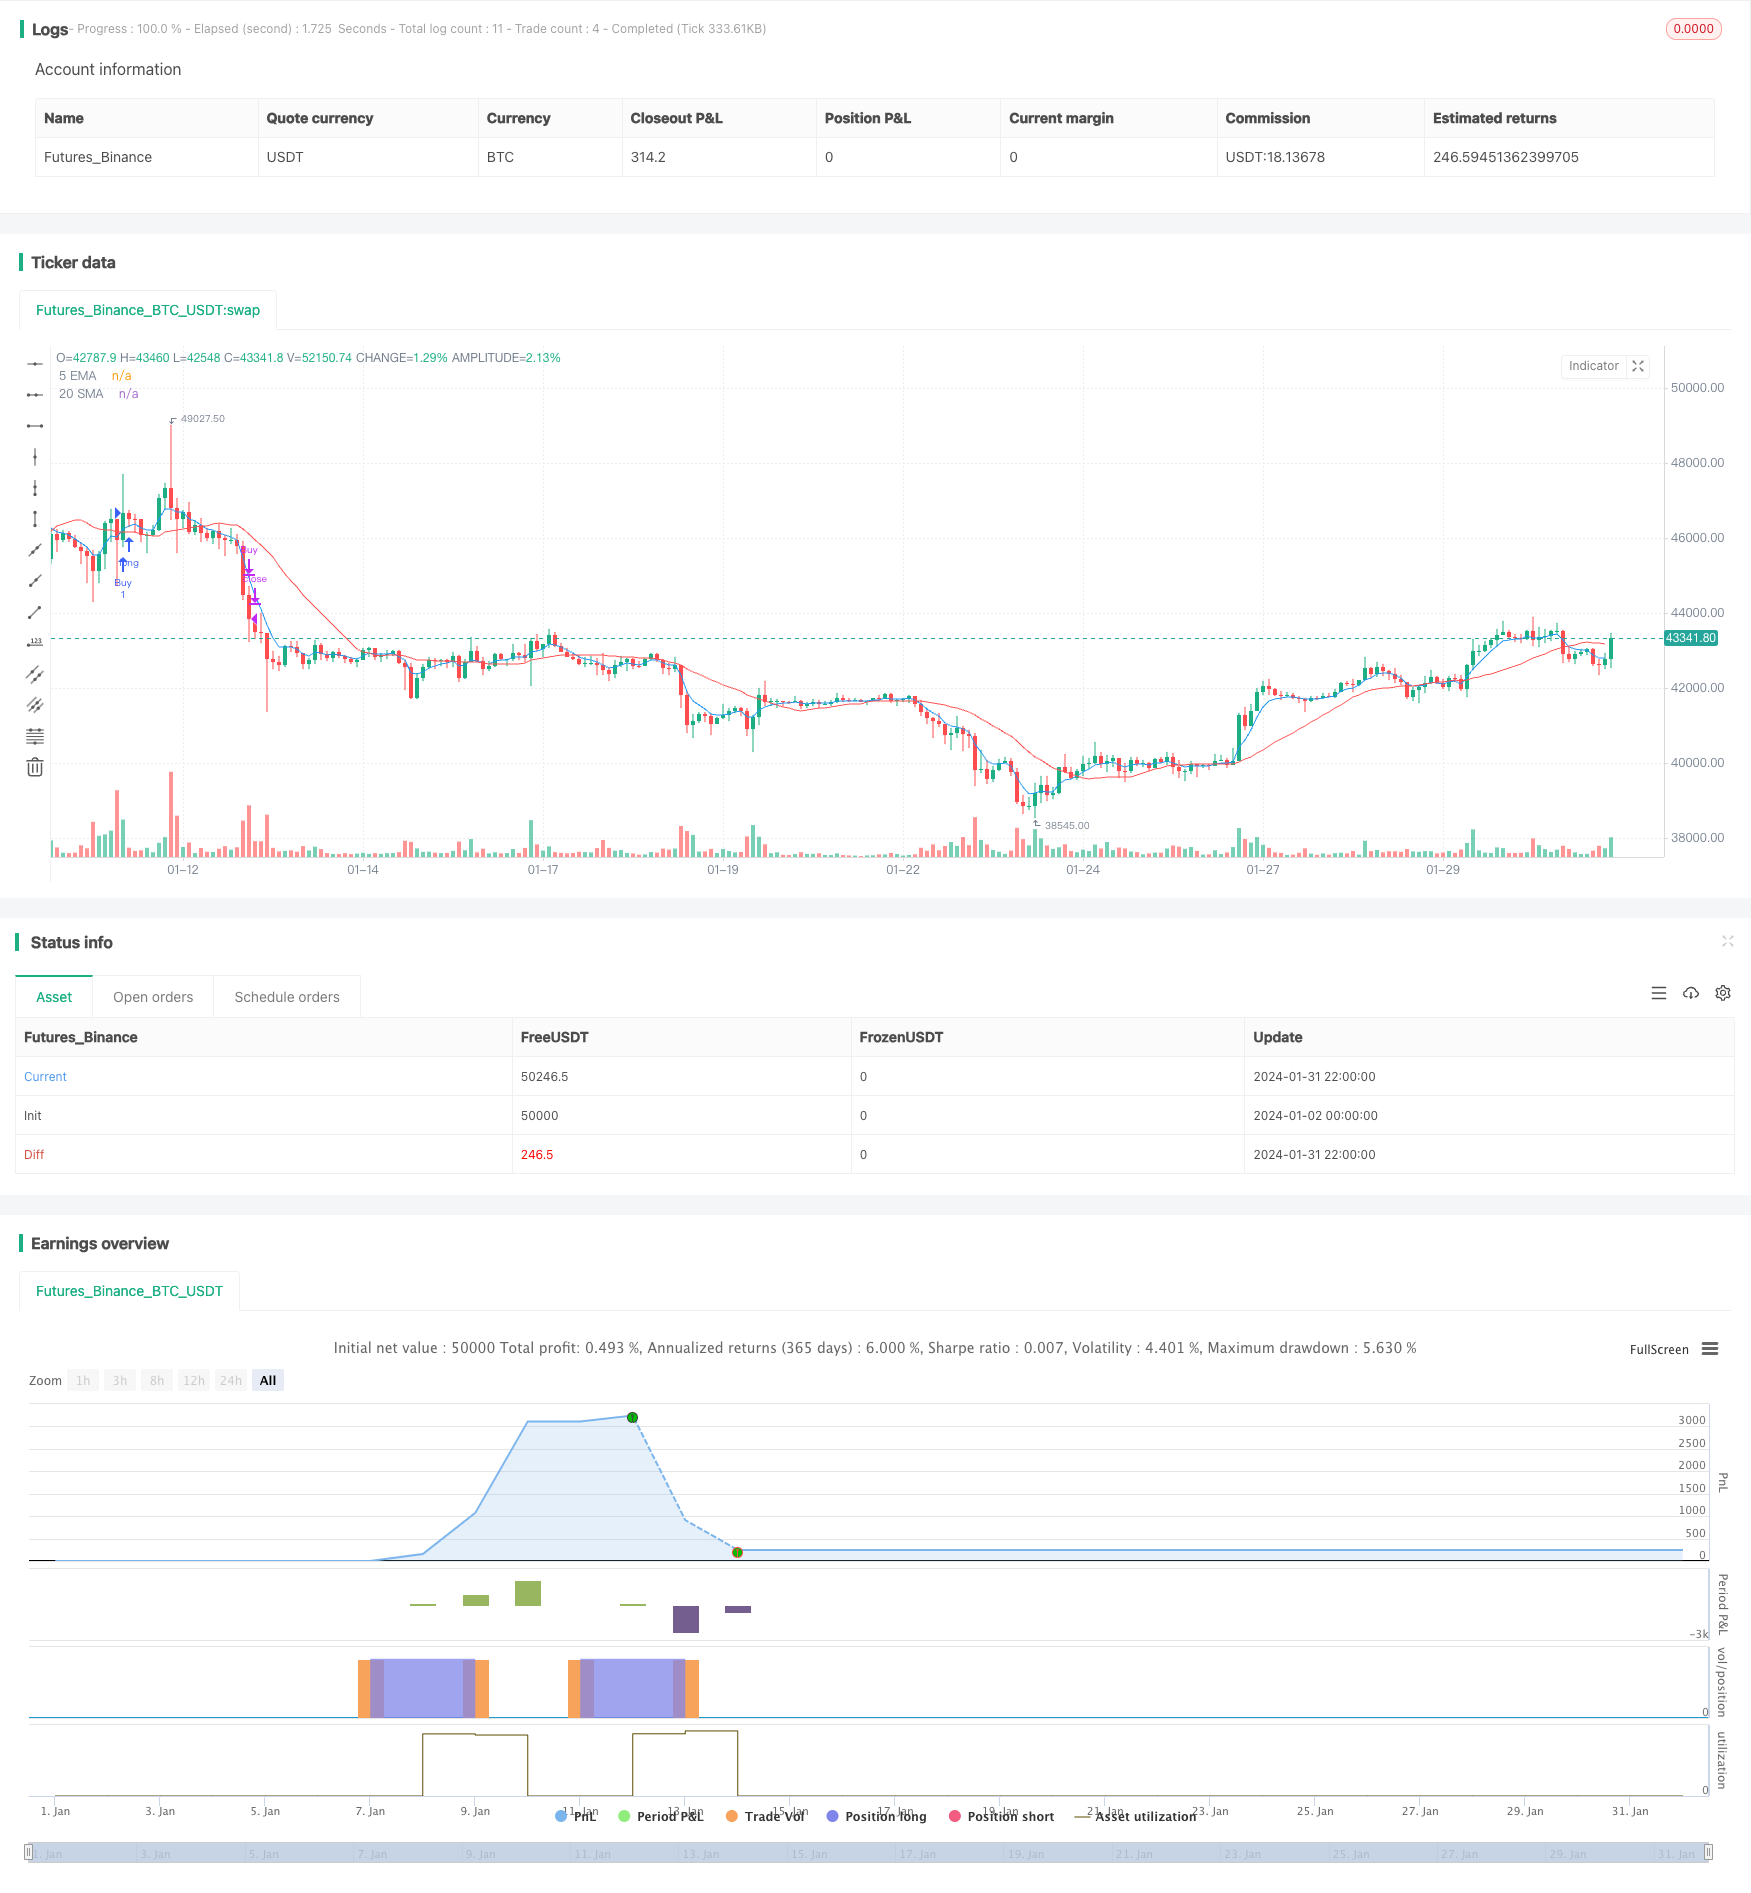
概述
该策略通过计算5日指数移动平均线(EMA)和20日简单移动平均线(SMA)的交叉来产生交易信号。当5日EMA上穿20日SMA时,采取看涨进入多单;当价格变化达到5%或-5%时,平仓离场。该策略同时结合交易量指数(TII)作为辅助判断指标。
策略原理
双指数移动平均线是一种广泛使用的技术指标。5日EMA代表近期价格变化趋势,20日SMA代表中期价格走势。当短期平均线上穿longer期平均线时,表示价格走势由跌转涨,可以入场做多;反之,短期平均线下穿longer期平均线时,表示价格由涨转跌,应考虑离场。
本策略设置5日EMA和20日SMA为交易信号。当5日EMA上穿20日SMA时Generate长仓信号;当持仓价格变化达到5%或-5%时,视为收益或止损离场。此外,结合TII指标作为辅助判断标准。TII大于0且大于前一周期时,表示目前处于价格上涨阶段,这时EMA和SMAgolden cross信号更为可靠。
详细的策略步骤如下:
- 计算5日EMA、20日SMA和TII指标
- 当5日EMA上穿20日SMA时,同时TII为正且大于前一周期,产生买入信号
- 进入长仓
- 当价格变化达到5%或-5%时,平仓离场
策略优势
该策略利用了移动平均线的黄金交叉交易信号,具有如下优势:
- 策略信号简单清晰,容易实现。
- 移动平均线是一种主流和常用的技术指标,黄金交叉是较为经典可靠的交易信号。
- 结合TII指标可以过滤部分不确定信号,提高策略胜率。
- 通过设定止损和止盈标准,可以有效控制单次交易风险。
总的来说,该策略规则清晰,易于理解和实现,利用了移动平均线交叉等成熟技术指标,风险控制措施较为全面,是一种适合新手学习使用的量化交易策略。
策略风险
该策略也存在一定的风险,主要包括:
- 移动平均线交叉信号会有一定的滞后。
- TII指标在盘整ры市中效果堪忧。
- 固定的止损止盈标准可能过于武断。
这些风险可以通过如下方式得到改善:
- 优化移动平均线参数,降低信号滞后。
- 添加其他辅助指标,提升信号的可靠性。
- 设置动态止损止盈标准。
所以该策略还有进一步优化的空间。
策略优化方向
该策略可以从以下几个方面进行优化:
优化移动平均线参数。可以测试更短期或更长期的EMA和SMA参数组合,找到更佳的参数对。
增加其他指标过滤。例如MACD,KDJ等指标的辅助判断可避免部分错误信号。
应用机器学习算法。使用统计方法或神经网络对历史数据进行建模,自动寻找更优的参数。
设定动态止损止盈。根据市场波动程度和个股特性调整止损幅度可以更好控制风险。
扩展至其他品种。在外汇,数字货币等其他品种上应用同样策略规则。
通过以上几个方向的改进,可以大幅提高策略的稳定性和盈利能力。
总结
本策略整体而言是一种易于理解和实现的双移动平均线交叉策略。它利用了移动平均线信号的优势,并辅以TII指标试图过滤错误信号。通过设定止损止盈来控制风险。该策略适合初学者学习,也还有很大的优化空间。如果继续完善参数设定、增加信号过滤和动态止损等,可以成为一种非常实用的量化交易策略。
/*backtest
start: 2024-01-02 00:00:00
end: 2024-02-01 00:00:00
period: 2h
basePeriod: 15m
exchanges: [{"eid":"Futures_Binance","currency":"BTC_USDT"}]
*/

//@version=5
strategy("EMA-SMA Crossover Strategy", shorttitle="EMA-SMA Cross", overlay=true)

// Define the moving averages
ema5 = ta.ema(close, 5)
sma20 = ta.sma(close, 20)
smaVolume10 = ta.sma(volume, 50)

majorLength = input(60, title="Major Length")
minorLength = input(30, title="Minor Length")
src = input(close, title="Source")

smaValue = ta.sma(src, majorLength)

positiveSum = 0.0
negativeSum = 0.0

for i = 0 to minorLength - 1
    price = na(src[i]) ? 0 : src[i]
    avg = na(smaValue[i]) ? 0 : smaValue[i]
    positiveSum := positiveSum + (price > avg ? price - avg : 0)
    negativeSum := negativeSum + (price > avg ? 0 : avg - price)

tii = 100 * positiveSum / (positiveSum + negativeSum)

// Buy condition: 5 EMA crosses above 20 SMA
buyCondition = ta.crossover(ema5, sma20) and tii > 0 and tii >= tii[1]

//and volume > smaVolume10 //

// Track entry price
var entryPrice = 0.0
if (buyCondition)
    entryPrice := close

// Calculate percentage change from entry price
priceChange = close / entryPrice - 1

// Plotting the moving averages on the chart
plot(ema5, color=color.blue, title="5 EMA")
plot(sma20, color=color.red, title="20 SMA")

// Highlighting buy signals and exit signals on the chart
// plotshape(series=buyCondition, title="Buy Signal", location=location.belowbar, color=color.green, size=size.small, style=shape.labelup, text="Buy")

// Strategy entry and exit
if (buyCondition)
    strategy.entry("Buy", strategy.long)

// Exit conditions
if (strategy.opentrades > 0)
    if (priceChange >= 0.05 or priceChange <= -0.05)
        strategy.close("Buy")