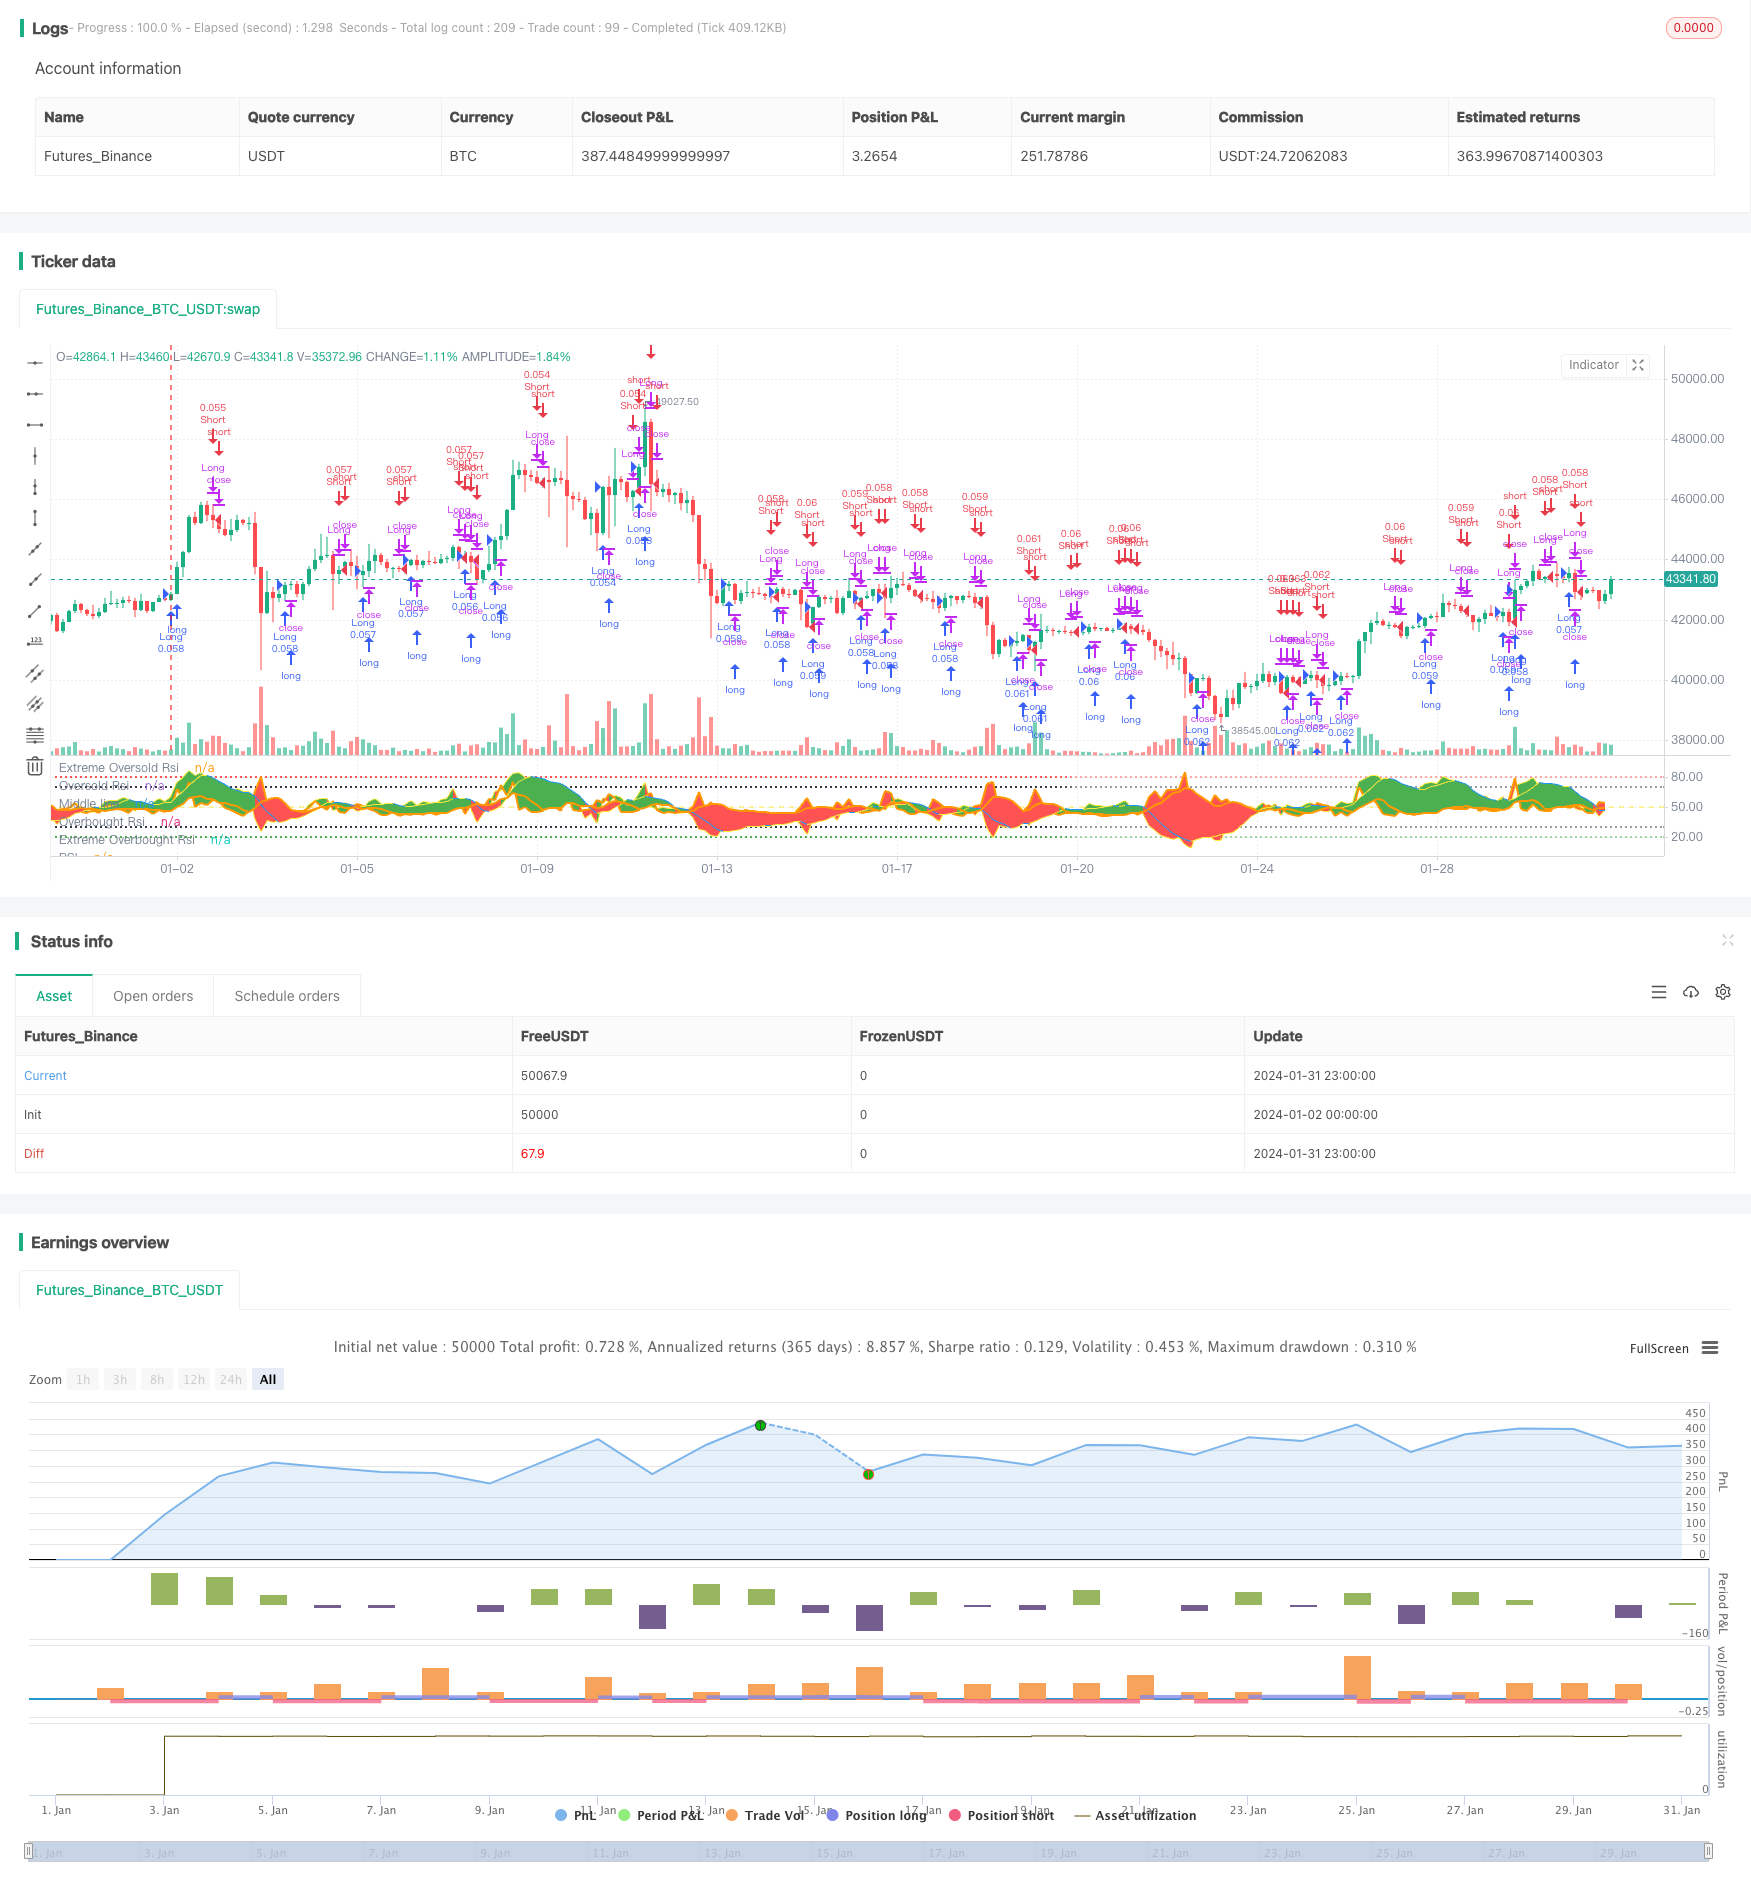
概述
VRSI与MARSI策略利用移动平均线来平滑RSI指标,实现了一个双指标策略。该策略同时使用价格的RSI指标和成交量的RSI指标,结合其移动平均线来产生交易信号。当价格的RSI指标上涨时做多,当价格的RSI指标下跌时做空。同时观察成交量的RSI指标的变化来判断市场力量和可能的趋势变化。
策略原理
该策略首先计算价格的9周期RSI指标(RSI),以及成交量的9周期RSI指标(VRSI)。然后计算这两个RSI指标的5周期简单移动平均(MARSI和MAVRSI)。
交易信号的产生基于MARSI指标。当MARSI上涨时做多,当MARSI下跌时做空。此外,MAVRSI指标被用来判断市场力量和可能的趋势变化。
例如,在多头行情中,如果价格继续上涨但成交量出现下降,这预示着多头力量可能在减弱,应当准备平仓。反过来,在空头行情中如果价格继续下跌但成交量出现上涨,这预示着空头力量增强,可以继续持有空单。
优势分析
该策略结合双RSI指标的移动平均线,能够有效抓住趋势,同时利用成交量的变化来判断市场力量,避免被套。相比单一RSI指标,该策略可以更准确地把握市场节奏。
移动平均线的使用也能够过滤掉部分噪音,使得信号更加可靠。此外,不同参数的设置如RSI周期和移动平均线周期也为策略的优化提供了可能。
风险分析
该策略最主要的风险在于双重指标之间可能会产生背离。当价格和成交量之间产生背离时,交易信号也会变得不那么可靠。这时需要人工判断指标之间的关系。
另一个风险是在盘整行情中容易被套。当价格在横盘整理时,RSI指标容易震荡上下触发不必要的交易信号。这时需要调整参数或判断指标的绝对位置。
优化方向
该策略可以从以下几个方面进行优化:
调整RSI指标和移动平均线的参数,找到最优参数组合
在产生交易信号时增加其他条件判断,例如RSI指标在超买超卖区域触发的反转信号可靠性更高
增加止损策略,设置移动止损或指标止损
结合其他指标,例如K线形态、波动率指标等来避免被套
总结
VRSI与MARSI策略成功结合了价格和成交量的RSI指标,双重指标之间的比较和判断可以提高信号的准确性和盈利率。优化的参数设置和止损策略也为其稳定运行提供了可能。总的来说,该策略利用指标之间的组合,获得了比单一RSI指标更优异的表现。
/*backtest
start: 2024-01-02 00:00:00
end: 2024-02-01 00:00:00
period: 3h
basePeriod: 15m
exchanges: [{"eid":"Futures_Binance","currency":"BTC_USDT"}]
*/

//@version=4
strategy("VRSI-MARSI Strategy", shorttitle="(V/MA)RSI Str.", overlay=false, default_qty_type=strategy.percent_of_equity, calc_on_order_fills=true, calc_on_every_tick=true, pyramiding=0, default_qty_value=5, initial_capital=100)

// RSI(close, ="RSI") and RSI(Volume, ="VRSI")
src = close, len = input(9, minval=1, title="Length RSI")
src2 = volume, len2 = input(9, minval=1, title="Length VRSI)")
up = rma(max(change(src), 0), len)
down = rma(-min(change(src), 0), len)
up2 = rma(max(change(src2), 0), len2)
down2 = rma(-min(change(src2), 0), len2)
rsi = down == 0 ? 100 : up == 0 ? 0 : 100 - (100 / (1 + up / down))
rsi2 = down2 == 0 ? 100 : up2 == 0 ? 0 : 100 - (100 / (1 + up2 / down2))

// MA(=Moving Average) of RSI(close, ="MARSI") and RSI(Volume, ="MAVRSI")
len3 = input(5, minval=1, title="Length MARSI")
marsi = sma(rsi, len3)
len4 = input(5, minval=1, title="Length MAVRSI")
marsi2 = sma(rsi2, len4)

// Plot:
// Default plot of RSI and VRSI: not visible but can be made visible
// Default plot MARSI and MAVRSI: visible
p1 = plot(rsi, linewidth=2, transp=100, color=color.yellow, title="RSI")
p2 = plot(rsi2, linewidth=2, transp=100, color=color.orange, title="VRSI")
m1 = plot(marsi, color=(marsi>=0 ? (marsi[1] < marsi ? color.yellow : color.blue) : (marsi[1] < marsi ? color.yellow : color.blue) ), linewidth = 2, transp = 0, title="MARSI")
m2 = plot(marsi2, color=color.orange, linewidth = 2, transp = 0, title="MAVRSI")

// Color fill:
// Default color fill "RSI - VRSI": not visible but can be made visible
// Default color fill "MARSI - MAVRSI": visible
fill(p1,p2, color = rsi>rsi2 ? color.green : color.red, transp=100, title="BG RSI-VRSI")
fill(m1,m2, color = marsi>marsi2 ? color.green : color.red, transp=75, title="BG MARSI-MAVRSI")

// Lines:
h2=hline(20, color=color.green, linestyle=hline.style_dotted, title="Extreme Oversold Rsi")
h3=hline(30, color=color.black, linestyle=hline.style_dotted, title="Oversold Rsi")
h5=hline(50, color=color.yellow, linestyle=hline.style_dashed, title="Middle line")
h7=hline(70, color=color.black, linestyle=hline.style_dotted, title="Overbought Rsi")
h8=hline(80, color=color.red, linestyle=hline.style_dotted, title="Extreme Overbought Rsi")

// Color fill between Lines "20-30" and "70-80" represents the crossing of "MARSI" and "MAVRSI":
fill(h2, h3, color=(marsi2 > marsi ? color.red : color.green), transp=80, title="20-30 BG color X MARSI/MAVRSI")
fill(h7, h8, color=(marsi2 > marsi ? color.red : color.green), transp=80, title="70-80 BG color X MARSI/MAVRSI")

///Long Entry///
longCondition = marsi > marsi[1]
if (longCondition)
    strategy.entry("Long", strategy.long)

///Long exit///
Xlong =input(true)
closeConditionLong = marsi < marsi[1] and Xlong
if (closeConditionLong)
    strategy.close("Long")

///Short Entry///
shortCondition = marsi < marsi[1]
if (shortCondition)
    strategy.entry("Short", strategy.short)

///Short exit///
Xshort =input(true)
closeConditionShort = marsi > marsi[1] and Xshort
if (closeConditionShort)
    strategy.close("Short")