概述
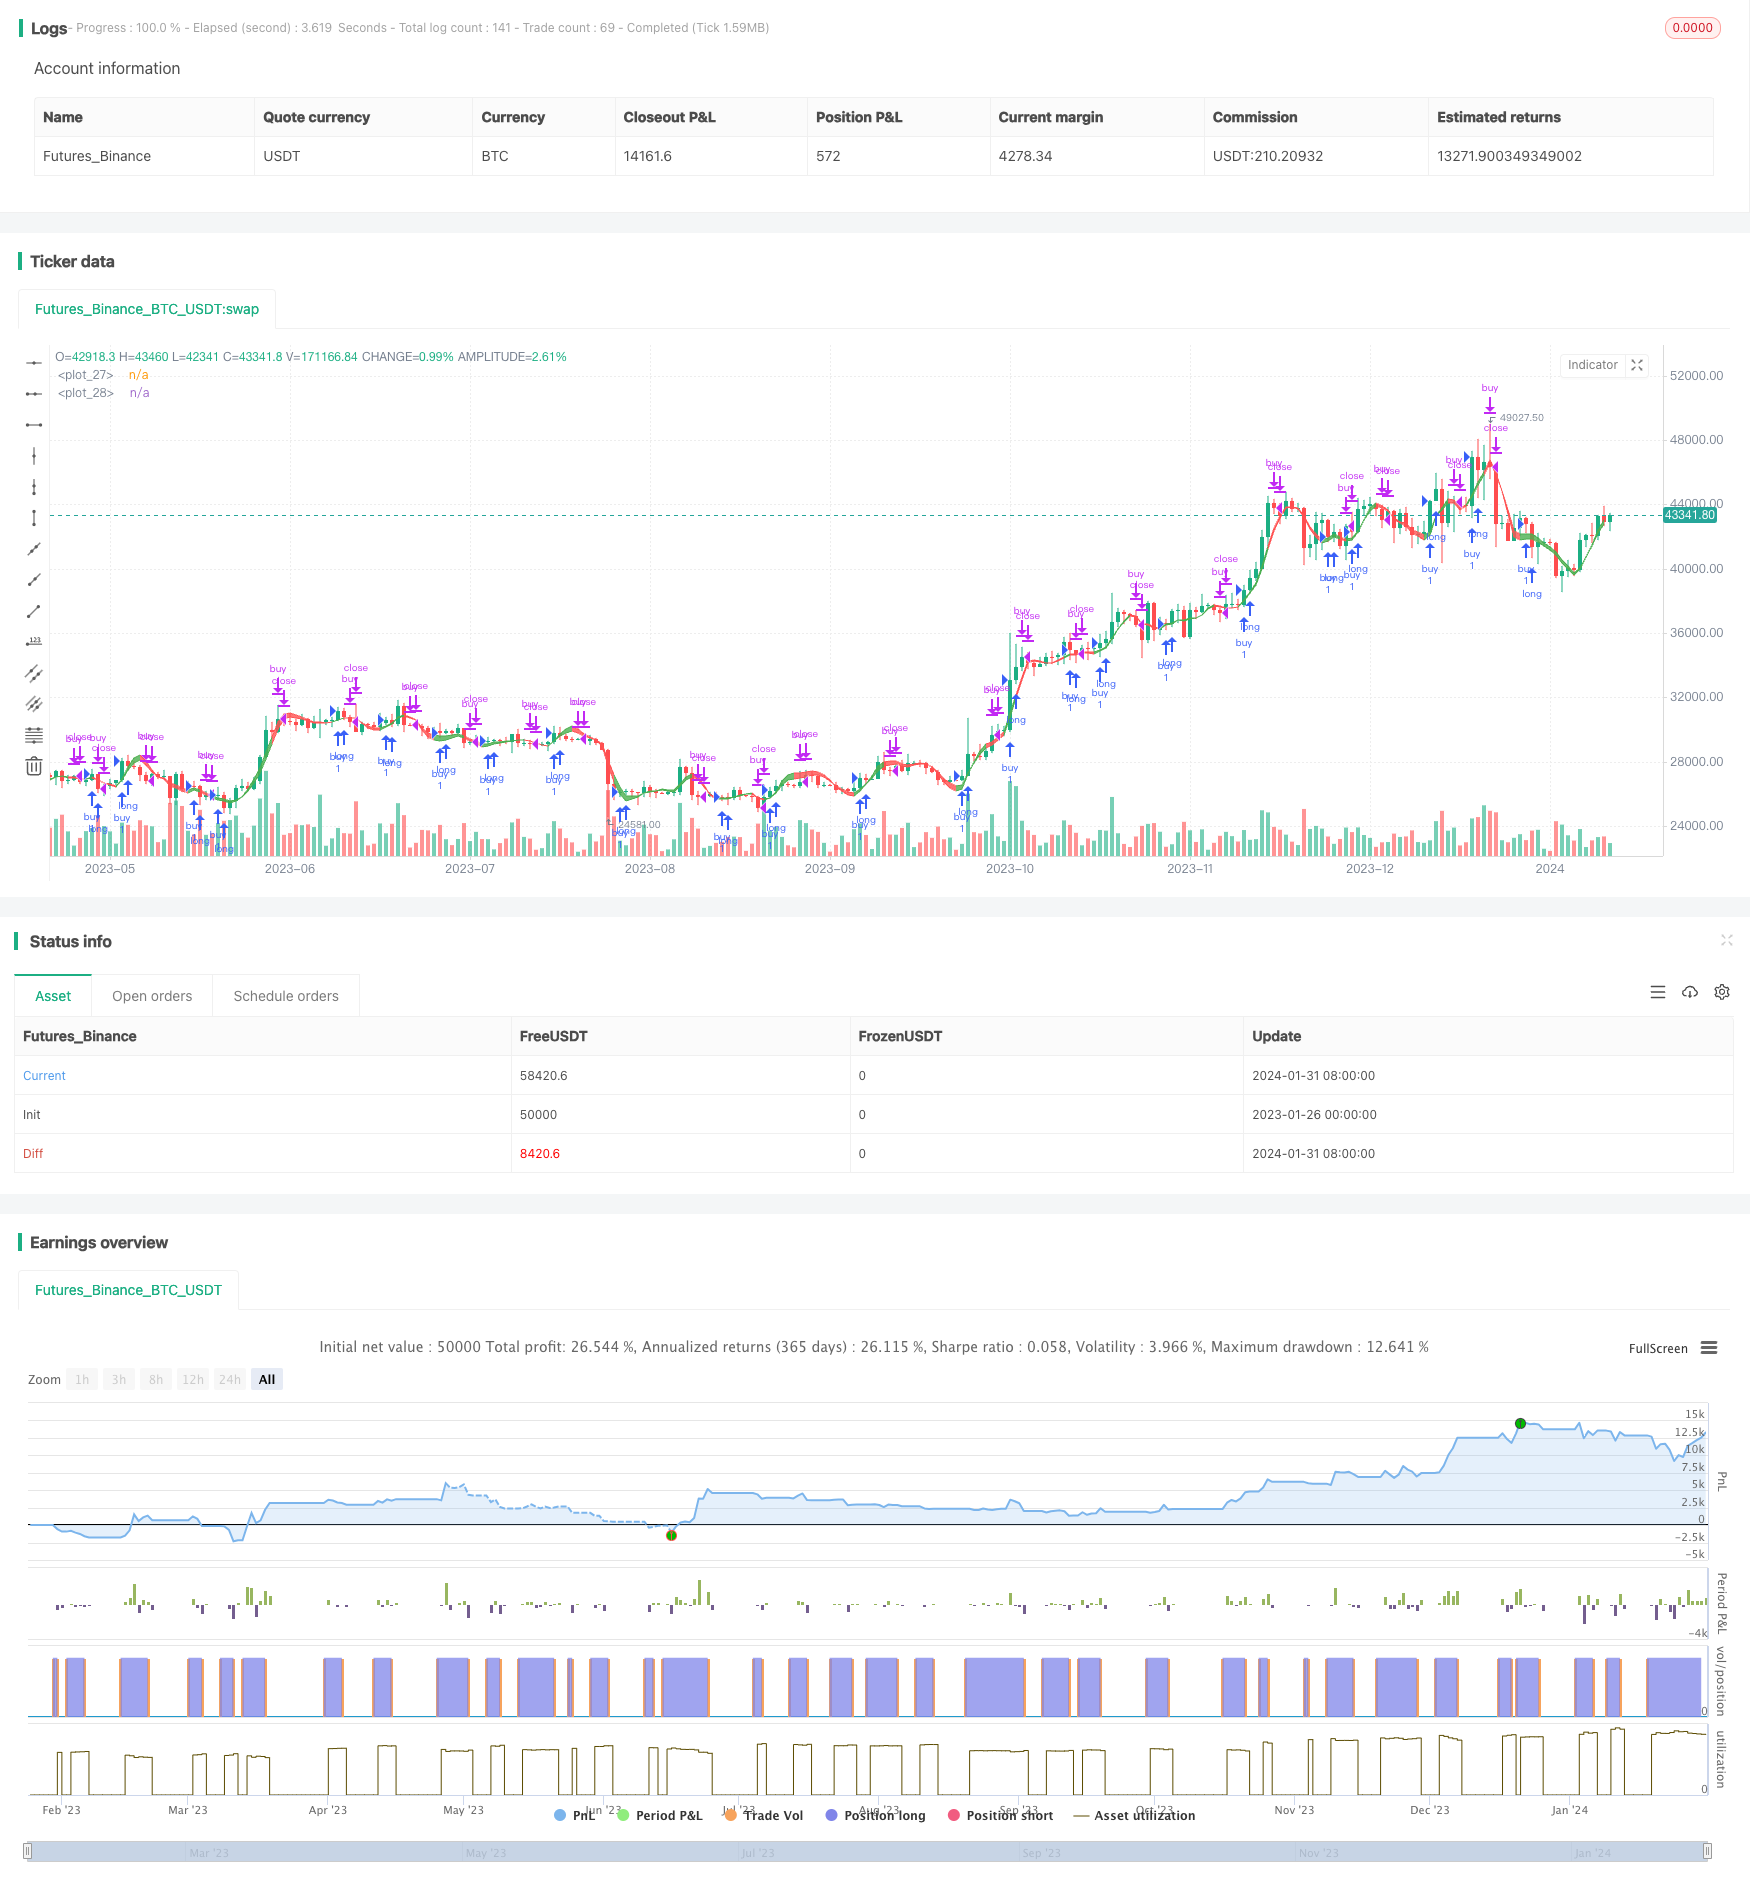
趋势预测双均线策略是一种试图在价格趋势反转之前预测趋势变化的策略。它基于LazyBear的WaveTrend指标进行扩展。该策略能够识别价格趋势,并通过曲线填充的视觉效果显示买入和卖出信号。
策略原理
该策略使用 LazyBear 的 WaveTrend 指标作为基础。WaveTrend 本身就是一个非常优秀的趋势跟踪指标。该策略在此基础上进行了扩展优化。主要步骤如下:
- 计算平均HLC价
- 计算EMA平均价格
- 计算价格绝对偏差的EMA
- 计算零界调整指标
- 计算趋势的EMA
- 计算快慢均线
通过这样的处理,可以滤波掉价格的随机波动,识别出较为清晰的趋势。快慢均线的交叉则可用于发出买入和卖出信号。
优势分析
该策略具有以下优势:
- 能够有效识别价格趋势
- 信号生成及时,可以提前预测趋势反转
- 通过曲线填充清晰可视化趋势
- 参数优化空间大,可以根据不同品种和周期进行调整
风险分析
该策略也存在一些风险:
- 像所有技术指标策略一样,在价格剧烈波动时,存在失败的风险
- 参数设置不当可能导致虚假信号
- 信号发生滞后,可能出现亏损
可以通过调整参数、结合其他指标等方法来缓解这些风险。
优化方向
该策略可以从以下几个方面进行优化:
- 调整参数,适应更多品种和周期
- 增加止损策略,控制亏损风险
- 结合其他指标进行组合,提高信号准确率
- 增加机器学习模型,辅助判断趋势及发出信号
总结
总的来说,趋势预测双均线策略是一个非常有前景的策略。它能够有效识别价格趋势,并尝试提前预测趋势的变化。通过一定的优化和改进,该策略可以成为一个强大的量化交易系统。它简单明了的交易逻辑和清晰的视觉效果,也让它成为一个值得学习和研究的策略。
策略源码
/*backtest
start: 2023-01-26 00:00:00
end: 2024-02-01 00:00:00
period: 1d
basePeriod: 1h
exchanges: [{"eid":"Futures_Binance","currency":"BTC_USDT"}]
*/

//@version=4
strategy("BreakingDawn [JackTz]", overlay = true)

// WaveTrend [LazyBear]
// ░░░░░░░░░░░░░░░░░░░░░░░░░░░░░░░░░░░░░░░░░░░░░░░░░░░░░░░░░░░░░░░░░░░░░░░░░░░░░░░░░░░░░░░░░░░░░░░░░░░░░░░░░░░░░░░░░░░░░░░░░░░░░░░░░░░░░░░░░░░░░░░░░░

n1 = input(10, "Channel Length")
n2 = input(21, "Average Length")

WTfactor = input(4, title=" WTFactor")
averageHlc3 = sum(hlc3, WTfactor) / WTfactor
ap = averageHlc3
esa = ema(ap, n1)
d = ema(abs(ap - esa), n1)
ci = (ap - esa) / (0.015 * d)
tci = ema(ci, n2)
wt1 = tci
wt2 = sma(wt1,4)
wtAvg = wt1-wt2
wtPeriodAvgVal = wtAvg * 45 + averageHlc3
wtPeriodAvg2Val = wtAvg * 25 + averageHlc3

buy = wtAvg[1] < wtAvg and wtAvg < close
sell = wtAvg[1] > wtAvg

fillColor = buy ? color.green : color.red
control = plot(wtPeriodAvgVal, color = fillColor)
signal = plot(wtPeriodAvg2Val, color = fillColor)
fill(signal, control, color = fillColor)

if year > 2016
    strategy.entry("buy", strategy.long, when = buy)
    strategy.close("buy",when = sell)