概述
本策略的名称叫做“基于一云突破和ADX指标的量化交易策略”。它结合了一云图形技术分析和平均趋向指数(ADX)指标来决定何时建立多头或空头头寸。具体来说,它在价格突破云图形的关键区域,且ADX指标显示强劲趋势时建立头寸。
策略原理
该策略使用乌盘指标中的“一云图形”以确定关键支持和阻力区域。它同时结合ADX指标判断趋势强度。具体交易策略规则如下:
多头建仓信号:
- 天线线转向上穿基准线
- 迟行线转向上穿0轴
- 价格高于云图形上沿
- ADX值低于45(表明趋势未过度扩张)
- +DI值高于-DI值(表明为上涨趋势)
空头建仓信号:
- 天线线转向下穿基准线
- 迟行线转向下穿0轴
- 价格低于云图形下沿
- ADX值高于45(表明趋势可能反转)
- +DI值低于-DI值(表明为下跌趋势)
优势分析
该策略结合图形技术分析和趋势分析指标,能有效判断市场走势和强势区域。具体优势如下:
- 使用一云图形判断关键支持阻力区域,能抓住强势趋势
- 结合ADX指数判断真实趋势强度,避免错误交易
- 规则清晰易操作,容易实盘
风险和解决方法
该策略也存在一些风险,主要集中在ADX指数判定上的不稳定性。具体风险和解决方法如下:
- ADX计算有滞后性,可能错过快速反转。可以适当降低ADX参数,使其更灵敏
- ADX在震荡行情中效果不佳。可以增加其他指标过滤,如BOLL通道等
- 一云图形也可能出现失效。可以适当调整参数或增加其他指标辅助
策略优化建议
该策略还可以从以下几个方面进行优化:
- 调整一云图形参数,适应更多品种
- 增加止损策略,控制单笔损失
- 结合更多指标,形成指标组合过滤信号
- 增加模型预测模块,利用机器学习进一步判断趋势信号 effector
总结
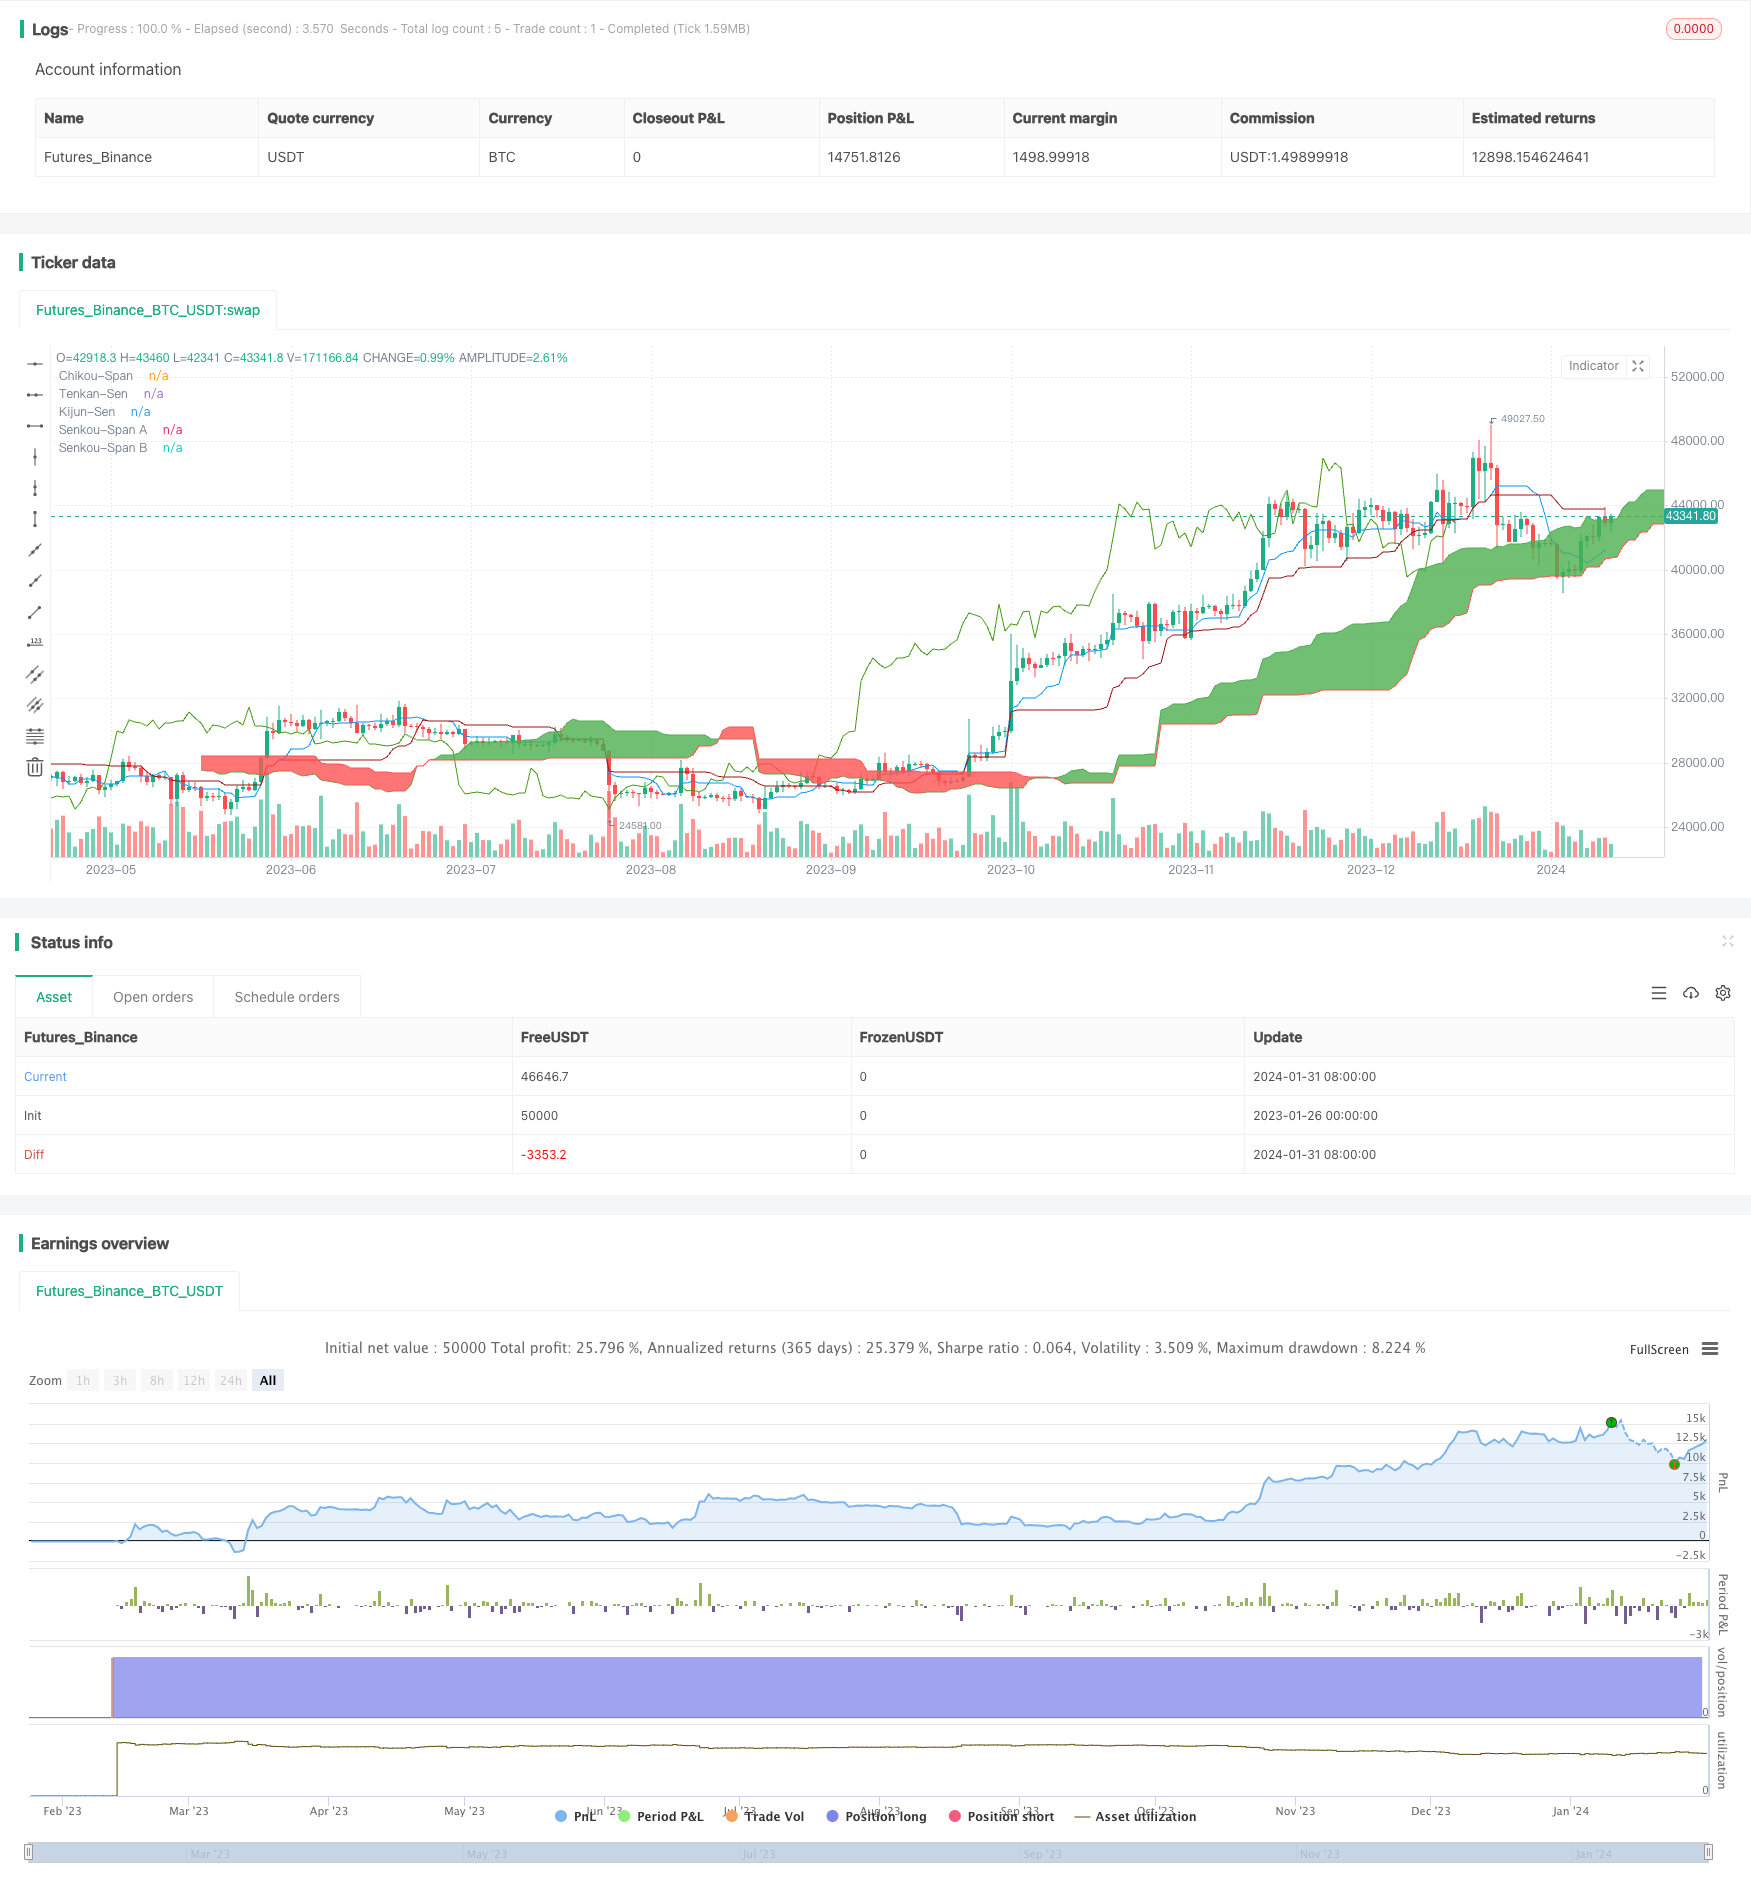
本策略结合一云图形技术分析和ADX趋势判断指标,形成了一套清晰完整的量化交易策略。它判断关键支持阻力区域同时兼顾趋势判断,能有效抓住市场机会。该策略易于实盘,也存在可优化的空间,整体是一套优质的量化策略。
策略源码
/*backtest
start: 2023-01-26 00:00:00
end: 2024-02-01 00:00:00
period: 1d
basePeriod: 1h
exchanges: [{"eid":"Futures_Binance","currency":"BTC_USDT"}]
*/

// This source code is subject to the terms of the Mozilla Public License 2.0 at https://mozilla.org/MPL/2.0/
// © Coinrule

//@version=5
strategy('Ichimoku Cloud with ADX (By Coinrule)',
         overlay=true,
         initial_capital=1000,
         process_orders_on_close=true,
         default_qty_type=strategy.percent_of_equity,
         default_qty_value=30,
         commission_type=strategy.commission.percent,
         commission_value=0.1)

showDate = input(defval=true, title='Show Date Range')
timePeriod = time >= timestamp(syminfo.timezone, 2022, 1, 1, 0, 0)


// Stop Loss and Take Profit for Shorting
Stop_loss = input(1) / 100
Take_profit = input(5) / 100
longStopPrice = strategy.position_avg_price * (1 - Stop_loss)
longTakeProfit = strategy.position_avg_price * (1 + Take_profit)


// Inputs
ts_bars = input.int(9, minval=1, title='Tenkan-Sen Bars')
ks_bars = input.int(26, minval=1, title='Kijun-Sen Bars')
ssb_bars = input.int(52, minval=1, title='Senkou-Span B Bars')
cs_offset = input.int(26, minval=1, title='Chikou-Span Offset')
ss_offset = input.int(26, minval=1, title='Senkou-Span Offset')
long_entry = input(true, title='Long Entry')
short_entry = input(true, title='Short Entry')

middle(len) => math.avg(ta.lowest(len), ta.highest(len))

// Ichimoku Components
tenkan = middle(ts_bars)
kijun = middle(ks_bars)
senkouA = math.avg(tenkan, kijun)
senkouB = middle(ssb_bars)

// Plot Ichimoku Kinko Hyo
plot(tenkan, color=color.new(#0496ff, 0), title='Tenkan-Sen')
plot(kijun, color=color.new(#991515, 0), title='Kijun-Sen')
plot(close, offset=-cs_offset + 1, color=color.new(#459915, 0), title='Chikou-Span')
sa = plot(senkouA, offset=ss_offset - 1, color=color.new(color.green, 0), title='Senkou-Span A')
sb = plot(senkouB, offset=ss_offset - 1, color=color.new(color.red, 0), title='Senkou-Span B')
fill(sa, sb, color=senkouA > senkouB ? color.green : color.red, title='Cloud color', transp=90)

ss_high = math.max(senkouA[ss_offset - 1], senkouB[ss_offset - 1])
ss_low = math.min(senkouA[ss_offset - 1], senkouB[ss_offset - 1])


// ADX
[pos_dm, neg_dm, avg_dm] = ta.dmi(14, 14)


// Entry/Exit Signals
tk_cross_bull = tenkan > kijun
tk_cross_bear = tenkan < kijun
cs_cross_bull = ta.mom(close, cs_offset - 1) > 0
cs_cross_bear = ta.mom(close, cs_offset - 1) < 0
price_above_kumo = close > ss_high
price_below_kumo = close < ss_low

bullish = tk_cross_bull and cs_cross_bull and price_above_kumo and avg_dm < 45 and pos_dm > neg_dm
bearish = tk_cross_bear and cs_cross_bear and price_below_kumo and avg_dm > 45 and pos_dm < neg_dm

strategy.entry('Long', strategy.long, when=bullish and long_entry and timePeriod)
strategy.close('Long', when=bearish and not short_entry)

strategy.entry('Short', strategy.short, when=bearish and short_entry and timePeriod)
strategy.close('Short', when=bullish and not long_entry)