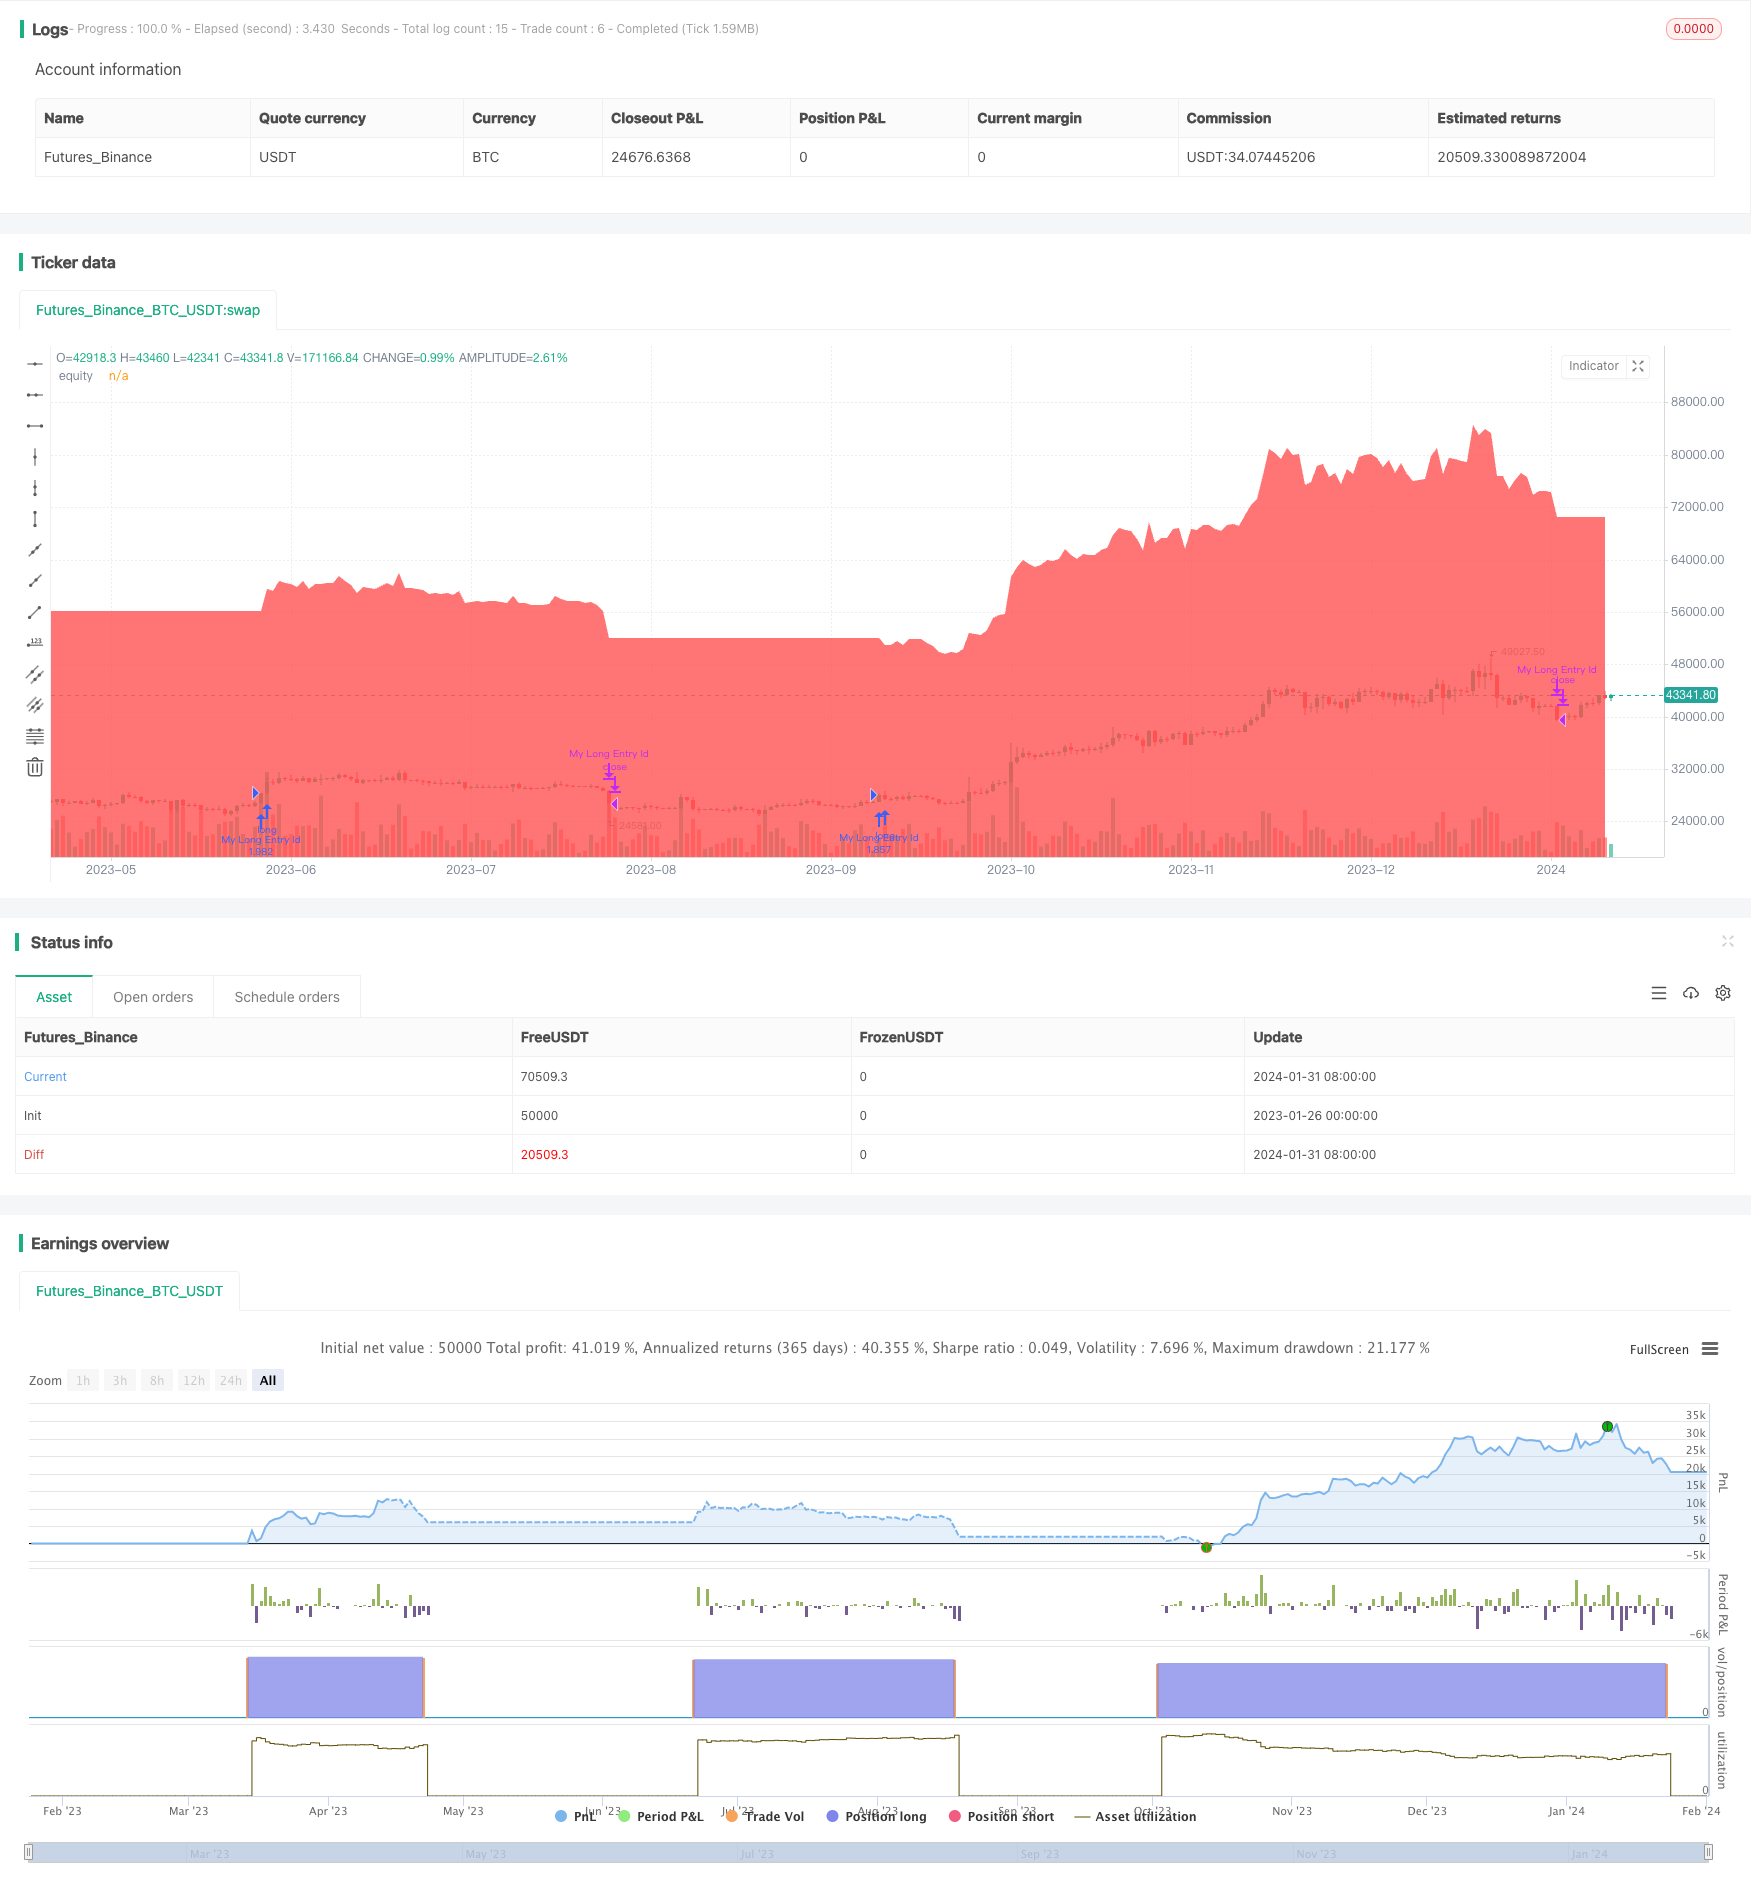
The Supertrend Bitcoin Long Line Strategy is a Bitcoin trading strategy that only takes long positions. It uses a combination of the SuperTrend indicator, RSI (Relative Strength Index), and ADX (Average Directional Index) to determine entry points.
The strategy will open a long position when the following entry conditions are met:
The strategy will close the long position when the SuperTrend indicator turns positive.
The strategy uses 100% of the equity for each trade, with the margin for long positions set at 10%. It plots the strategy’s equity on the chart for analysis. This setup aims to capture long trends in the Bitcoin market under specific conditions defined by these technical indicators.
The biggest advantage of the Supertrend Bitcoin Long Line Strategy is that it only enters the market after the technical indicators have fully confirmed the market trend. Specifically, it requires short-term and long-term RSI to show overbought or oversold signals at the same time, indicating that major and minor cycle trends have reached a consensus to filter out a lot of noisy trading opportunities. while combining ADX to determine the strength of the trend, avoid going with the flow in a sideways market.
This kind of long-only, no-short strategy also avoids the risk of unlimited losses in short selling. In the long-term bull market cycle, chasing rises and killing falls can obtain better win rate and return on investment.
The biggest risk of the Supertrend Bitcoin Long Line Strategy is that it cannot respond to short-term adjustments and pullbacks caused by sudden news. When bearish news hits the market and prices plummet, being long-only means it cannot switch direction, which will then suffer huge losses. This is an unavoidable residual risk.
Another potential risk is that the effectiveness of SuperTrend and other indicators in determining market structure turning points is not ideal. They tend to lag, thus missing the best entry or exit timing. This may lead to much lower returns than the market itself. To mitigate this risk, parameters can be appropriately adjusted or additional leading indicators can be added for confirmation.
The Supertrend Bitcoin Long Line Strategy has room for further optimization:
Free float indicators, OBV indicators, etc. can be added to judge buying and selling power to prevent chasing highs amid thin trading volumes
Volatility indicators can be combined to only enter when volatility increases, avoiding low volatility ranges where there is little profit
Automatic stop loss modules can be added to set retracement ranges to avoid excessive losses beyond risk tolerance
Parameter optimization can be performed to adjust RSI cycle parameters and improve indicator effectiveness
Machine learning models can be combined to enable dynamic parameter and multi-factor optimization
Through these optimizations, the stability, win rate and profit level of the strategy can be further improved.
The Supertrend Bitcoin Long Line Strategy is a simple and straightforward quantitative investment strategy. It aims to capture long bull runs in the Bitcoin or cryptocurrency market and obtain steady returns by chasing rises and killing falls. Although there are still some risks, through parameter adjustment and model optimization, this strategy can be further enhanced to become an advantageous quantitative trading tool. It provides investors with an overall optimistic outlook on the cryptocurrency market and a way to share the growth dividends of digital assets.
/*backtest start: 2023-01-26 00:00:00 end: 2024-02-01 00:00:00 period: 1d basePeriod: 1h exchanges: [{"eid":"Futures_Binance","currency":"BTC_USDT"}] */ //@version=5 strategy("Supertrend Bitcoin Strategy", overlay=true, default_qty_type=strategy.percent_of_equity, default_qty_value=100, initial_capital=1000, margin_long=0.1) atrPeriod = input(10, "ATR Length") factor = input.float(3.0, "Factor", step = 0.01) [_, direction] = ta.supertrend(factor, atrPeriod) adxlen = input(7, title="ADX Smoothing") dilen = input(7, title="DI Length") dirmov(len) => up = ta.change(high) down = -ta.change(low) plusDM = na(up) ? na : (up > down and up > 0 ? up : 0) minusDM = na(down) ? na : (down > up and down > 0 ? down : 0) truerange = ta.rma(ta.tr, len) plus = fixnan(100 * ta.rma(plusDM, len) / truerange) minus = fixnan(100 * ta.rma(minusDM, len) / truerange) [plus, minus] adx(dilen, adxlen) => [plus, minus] = dirmov(dilen) sum = plus + minus adx = 100 * ta.rma(math.abs(plus - minus) / (sum == 0 ? 1 : sum), adxlen) sig = adx(dilen, adxlen) if ta.change(direction) < 0 and ta.rsi(close, 21) < 66 and ta.rsi(close, 3) > 80 and ta.rsi(close, 28) > 49 and sig > 20 strategy.entry("My Long Entry Id", strategy.long) if ta.change(direction) > 0 strategy.close("My Long Entry Id") // Close long position plot(strategy.equity, title="equity", color=color.red, linewidth=2, style=plot.style_areabr)template: strategy.tpl:40:21: executing "strategy.tpl" at <.api.GetStrategyListByName>: wrong number of args for GetStrategyListByName: want 7 got 6