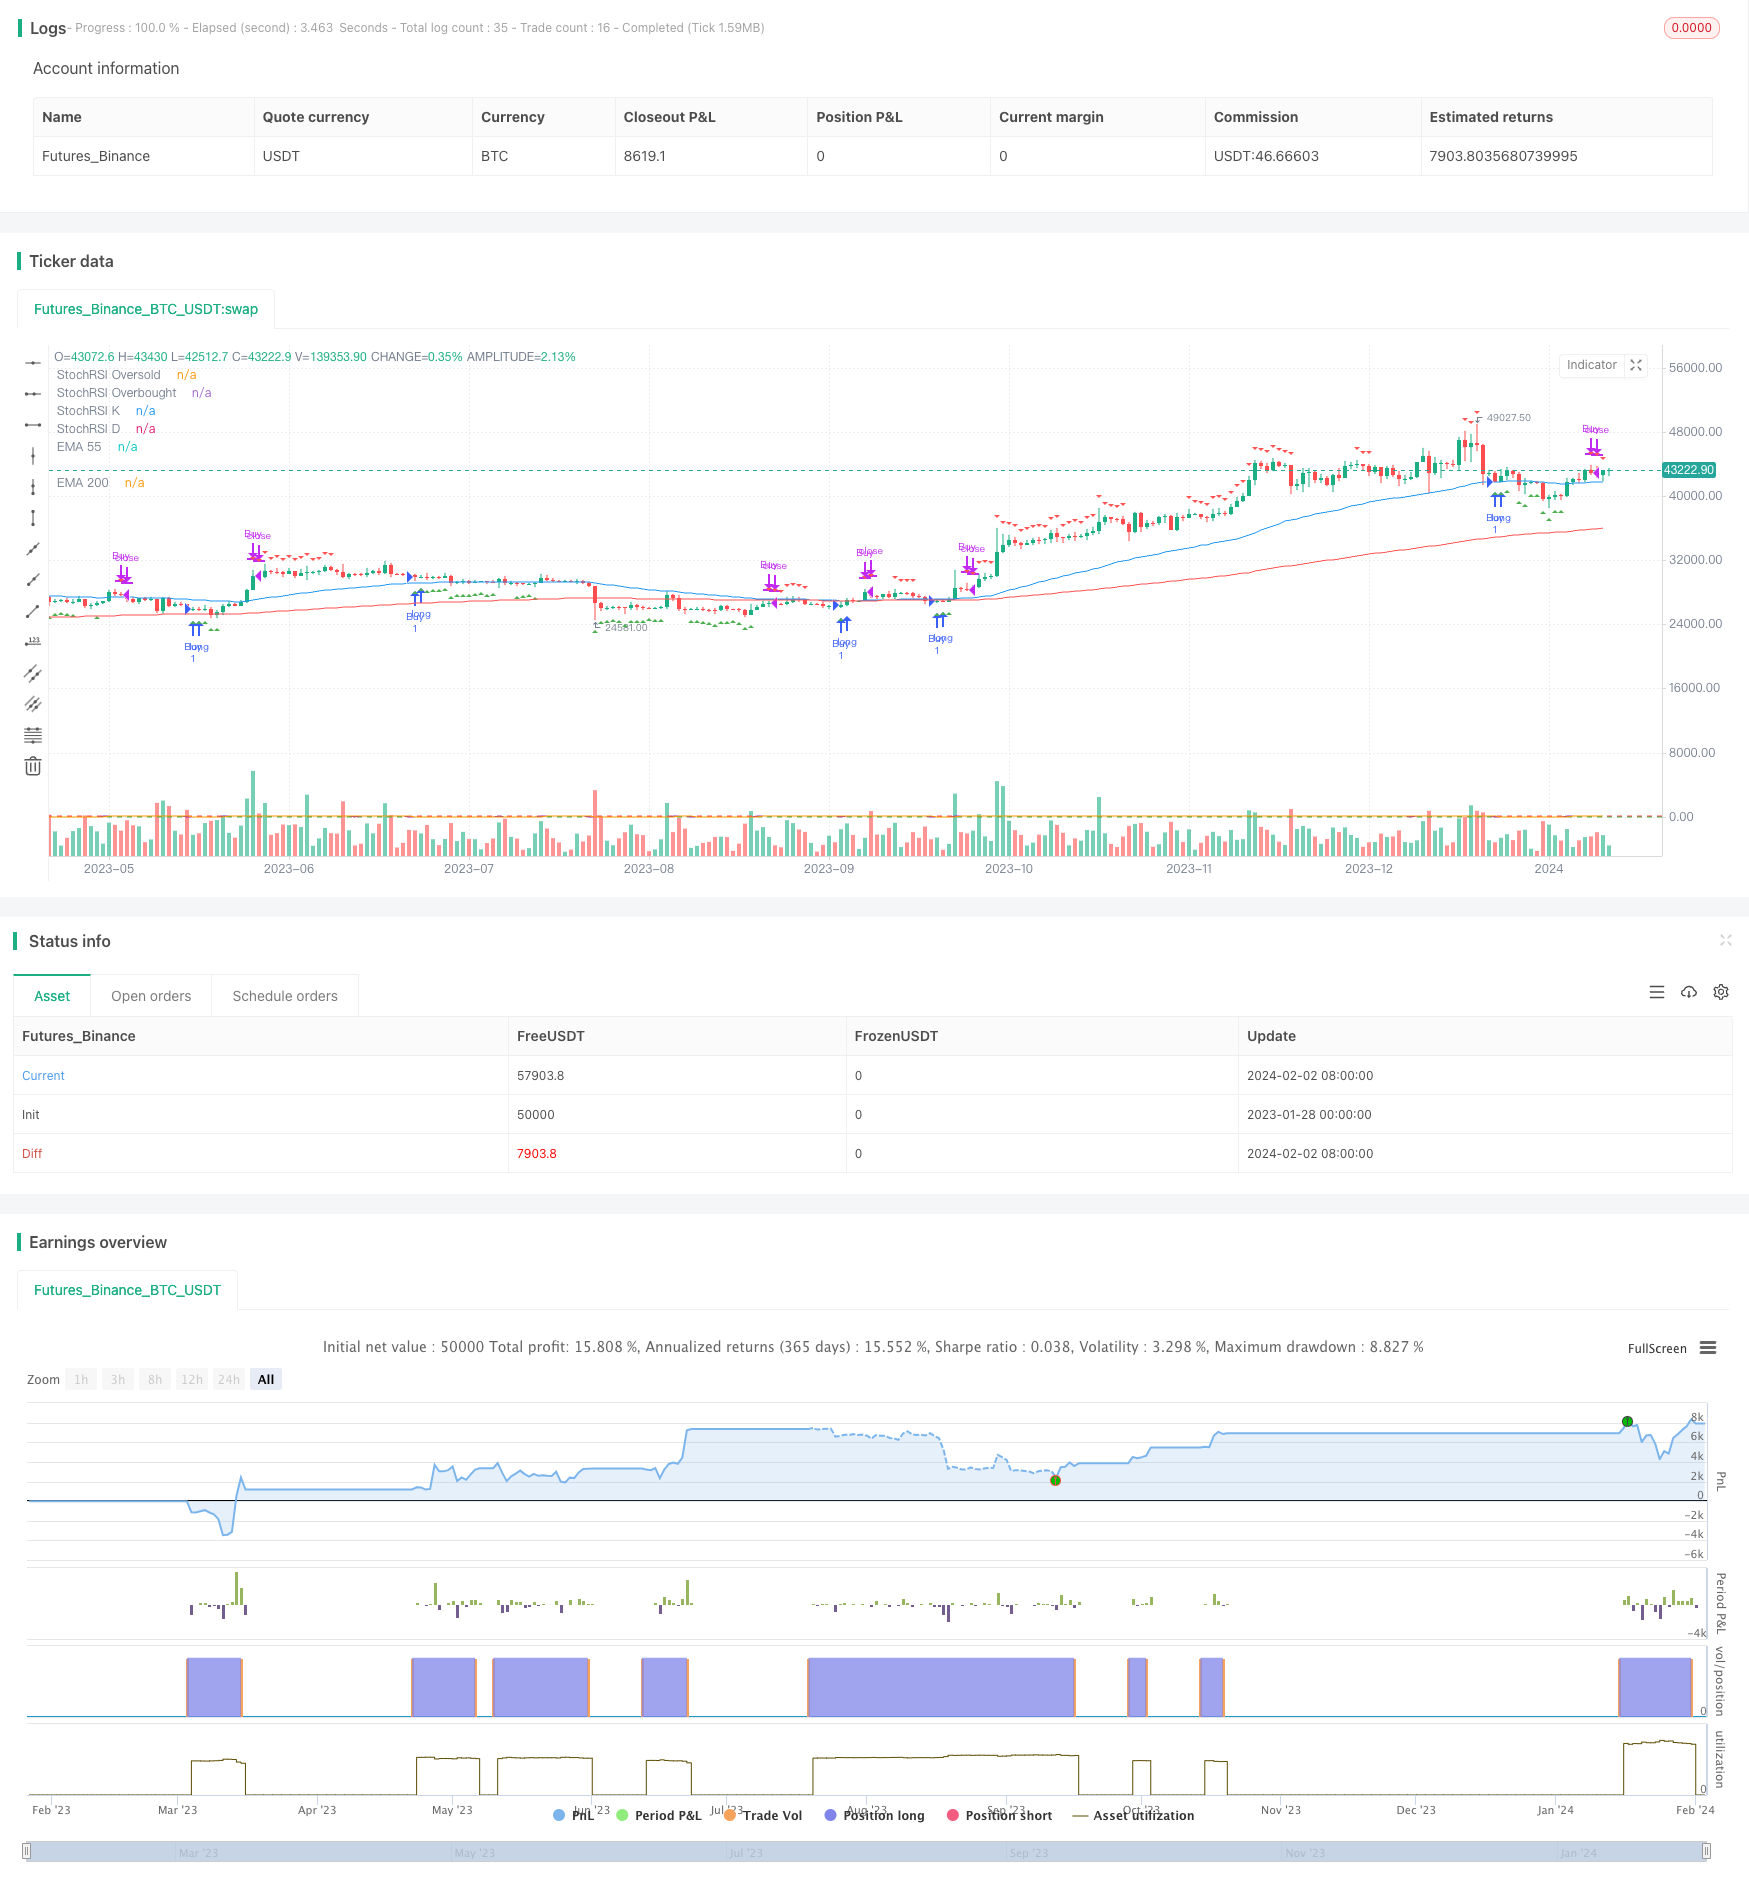
概述
该策略同时结合了Stochastic RSI和两条不同周期的EMA指标来产生交易信号。 当快线StochRSI低于20而55周期EMA高于200周期EMA时产生买入信号;当快线StochRSI上穿80时产生卖出信号。该策略综合了不同指标的优势,既考虑了价格动量也考虑了趋势方向,形成了一套较为稳定的交易策略。
策略原理
该策略主要由Stochastic RSI和两条EMA组成。Stochastic RSI是相对强弱指数的股票式指标,它结合了RSI和Stochastic Oscillator的优点,可以更清楚地观察市场的超买超卖现象。两条EMA分别反映了中短期和长期的价格趋势方向。
当Stochastic RSI低于20时表示市场处于超卖状态,这时如果短期EMA高于长期EMA,说明趋势仍然向上,就是股票的吸筹时期,这时买入可以获得较好的风险回报比。当Stochastic RSI上穿80时表示市场步入超买区域,应当考虑止损或止盈了。
优势分析
这套策略最大的优势就是指标之间形成互补。Stochastic RSI判断市场动量和超买超卖的同时,EMA判断主要趋势,一旦二者发出同向信号就可以大胆地进场。相比单一使用Stochastic RSI,这套策略可以过滤掉更多的假信号,从而获得更高的稳定性。
另外,这套策略操作简单,只要留意三个指标就可以做出决策,适合那些不想过多关注短期波动而更看重长线大趋势的投资者。
风险分析
这套策略也存在一定的风险。首先,EMA所判断的趋势可能发生转折,这时Stochastic RSI买入信号可能成为诱多信号。其次,市场可能出现长期滞涨,导致仓位长期兑现乏力。最后,参数设置不当也可能影响策略表现。
对此,建议采用止损来控制单笔损失。同时,也可以适当调整参数,如采用更长线的EMA周期判断趋势等。总的来说,这套策略风险还是可控的。
优化方向
这套策略还有几个主要的优化方向:
增加其他指标过滤,如捕获短期反转的RSI或ATR来避免假突破
增加机器学习算法,引入自适应参数优化机制
结合情绪指标、消息面等更多因素判定市场时点
采用仓位管理进一步降低风险,如固定份额法等
通过这些优化,可以使策略的稳定性和收益率得到显著提高。
总结
本策略综合运用stochastic RSI和EMA两个指标,兼顾了市场超买超卖状态和主要趋势判断。通过严格的 entrada退出机制,可以有效过滤市场噪音,获得较为稳定的策略收益。下一步通过参数优化、模型扩展、风险控制等手段,这套策略可以成为量化交易的重要选择之一。
/*backtest
start: 2023-01-28 00:00:00
end: 2024-02-03 00:00:00
period: 1d
basePeriod: 1h
exchanges: [{"eid":"Futures_Binance","currency":"BTC_USDT"}]
*/

//@version=4
strategy("Stochastic RSI and EMA Strategy", shorttitle="StochRSI & EMA", overlay=true)

// Input for Stochastic RSI settings
stoch_length = input(14, title="StochRSI Length")
k_period = input(3, title="K Period")
d_period = input(3, title="D Period")

// Input for EMA periods
ema1_period = input(55, title="EMA 55 Period")
ema2_period = input(200, title="EMA 200 Period")

// Calculate Stochastic RSI
stoch_rsi_k = sma(stoch(close, close, close, stoch_length), k_period)
stoch_rsi_d = sma(stoch_rsi_k, d_period)

// Calculate EMAs
ema1 = ema(close, ema1_period)
ema2 = ema(close, ema2_period)

// Plot EMAs on the chart
plot(ema1, color=color.blue, title="EMA 55")
plot(ema2, color=color.red, title="EMA 200")

// Plot Stochastic RSI on a separate pane
hline(20, "StochRSI Oversold", color=color.green)
hline(80, "StochRSI Overbought", color=color.red)
plot(stoch_rsi_k, color=color.purple, title="StochRSI K")
plot(stoch_rsi_d, color=color.orange, title="StochRSI D")

// Buy condition: StochRSI below 20 and EMA55 above EMA200
buy_condition = stoch_rsi_k < 20 and ema1 > ema2

// Sell condition: StochRSI above 80
sell_condition = stoch_rsi_k > 80

// Plot buy and sell signals on the chart
plotshape(series=buy_condition, title="Buy Signal", location=location.belowbar, color=color.green, style=shape.triangleup, size=size.small)
plotshape(series=sell_condition, title="Sell Signal", location=location.abovebar, color=color.red, style=shape.triangledown, size=size.small)

// Strategy entry and exit
strategy.entry("Buy", strategy.long, when=buy_condition)
strategy.close("Buy", when=sell_condition)