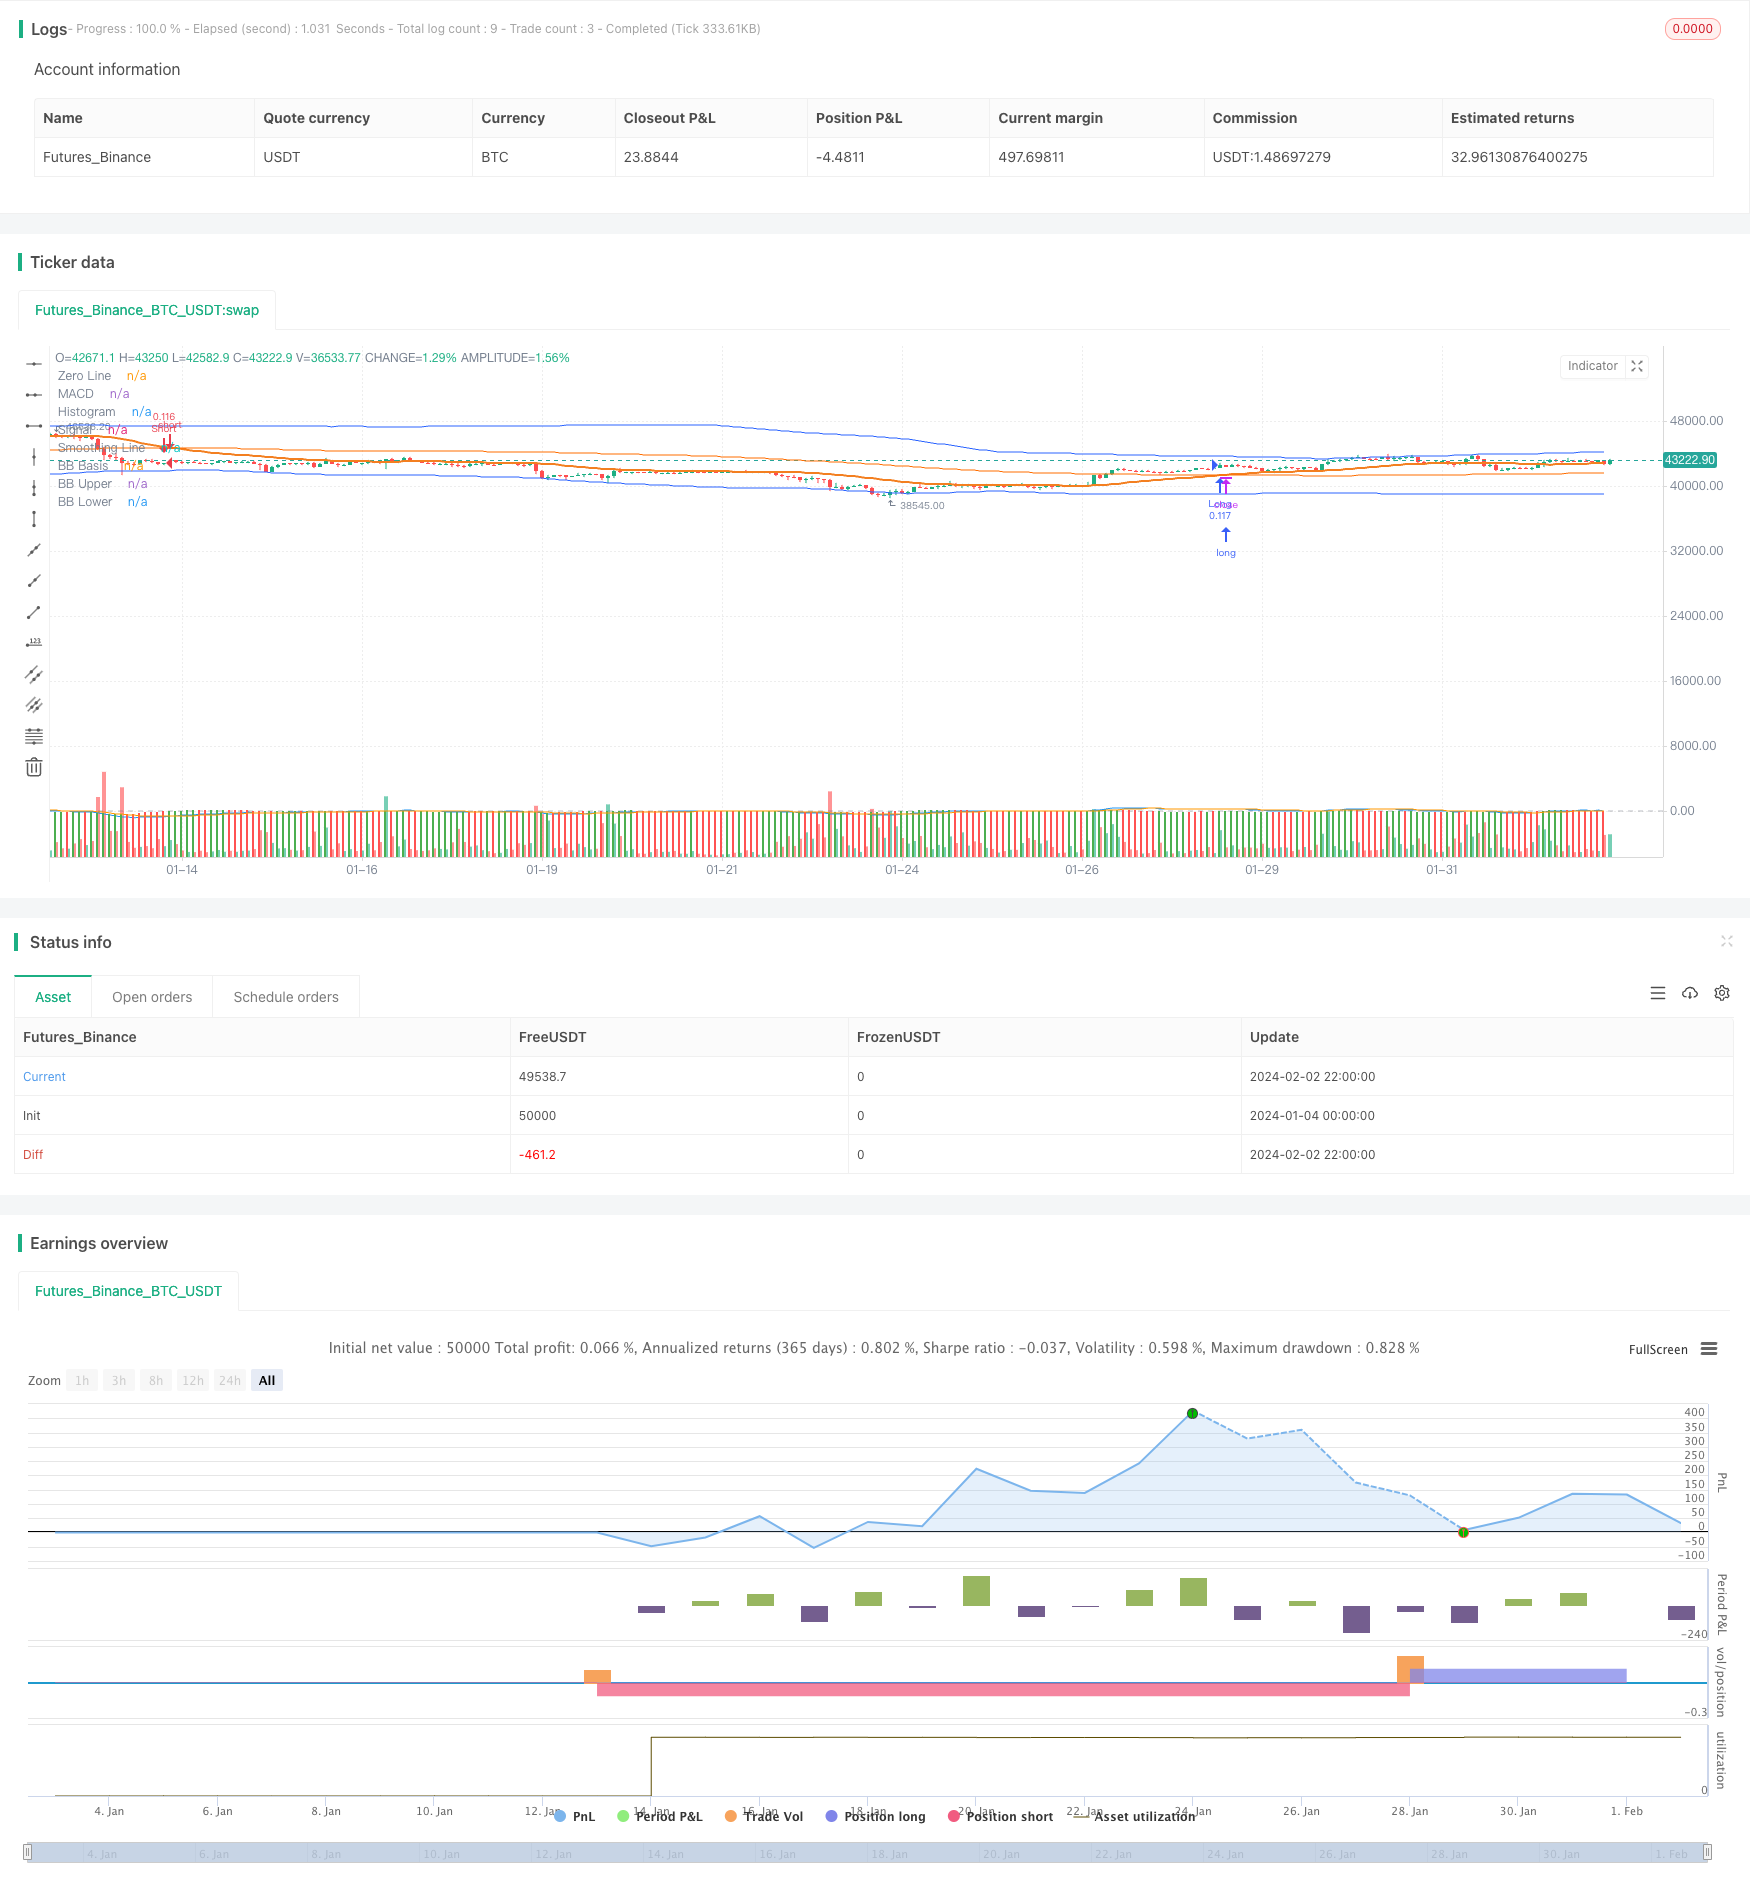
策略概述
该策略结合了布林带、移动平均线和MACD三种指标,形成一个较为完整的交易体系。它在判断市场趋势的同时,也能抓住部分反转机会。
策略名称与原理
本策略名称为“三角锚定趋势追踪策略”。该名称突出了它在判断趋势方向和锚定入市点位时,同时使用三种技术指标的特点。
其基本交易逻辑是:
判断趋势方向。通过布林带中轨、EMA移动平均线和MACD的零轴比较,来判断目前市场所处的多头阶段还是空头阶段。
寻找入市时机。在确定多头(或空头)趋势后,策略会根据EMA移动平均线是否突破布林中轨,以及MACD柱形线是否正(或负)向突破信号线来判断入市。
设置止盈止损。进入场内后,会预设固定止盈位和止损位。
策略优势分析
该策略最大的优势在于同时使用了趋势、均线和MACD三种不同类型的技术指标来指导决策。这使得它可以更准确判断市场走势,也更有利于抓住部分反转机会。
首先,布林带中轨线能清晰反映出当前阶段的主要趋势方向。EMA均线的作用则是跟踪趋势运行。它们的比较和结合,可以更准确地判断目前的多头和空头状况。
其次,布林带本身就具有比较强的包容性。中轨线附近也反映出一定的支撑压力位,因此EMA线的突破具有一定的信号价值。
再者,MACD的加入也可见多空能量的消长。它的绝对值大小代表群众情绪高涨或者冷淡,也可提示反转的可能性。
最后,策略预设了止盈止损条件,可控制单笔交易的风险收益情况,从而保证整体稳定运行。
策略风险分析
尽管该策略综合运用了多种分析工具,但仍有以下主要风险:
布林带参数设置不当,中轨线无法清晰反映主趋势。
均线系统发出多头信号,但MACD未明确转正,空头力量可能会扩大。
止盈止损范围设置过大,单笔亏损可能扩大。
主要的解决思路是:
调整布林带参数,确保中轨线有效反映主趋势。
引入更多技术指标判断多空能量。
评估历史交易情况,优化止盈止损参数。
策略优化方向
该策略还可从以下几个方面进一步优化:
在趋势判断上引入更多指标。如KDJ、ATR等辅助判断,提高判断准确率。
在操作层面设置更细致的止损方式。如移动止损、突破新高(低)后加大止损比例等。
评估不同品种的表现效果。调整参数适应更多行情特点。
测试效果和评估了不同时间框架和市场的回测结果。相应地调整参数。
增加机器学习算法,实现参数的自动优化和策略规则的动态更新。
总结
本策略同时运用布林带、移动平均线和MACD三大技术指标。它判断趋势清晰,具有一定的包容性,也可抓住部分反转机会。通过引入更多辅助工具判断和优化止盈止损策略,可望获得更稳定的交易表现。本策略值得进一步评估和改进,可望成为量化决策的有力工具。
/*backtest
start: 2024-01-04 00:00:00
end: 2024-02-03 00:00:00
period: 2h
basePeriod: 15m
exchanges: [{"eid":"Futures_Binance","currency":"BTC_USDT"}]
*/

//@version=5
strategy("Combined Strategy", overlay=true, shorttitle="Comb Strat", default_qty_type=strategy.percent_of_equity, default_qty_value=10)

// Precio de beneficio y Stop Loss
takeProfitTicks = 87636
stopLossTicks = 53350

// Bollinger Bands + EMA
length_bb = input(150, title="BB Length")
src_bb = input(close, title="BB Source")
mult = input(2.0, title="BB StdDev")
basis = ta.sma(src_bb, length_bb)
dev = mult * ta.stdev(src_bb, length_bb)
upper = basis + dev
lower = basis - dev

len_ema = input(34, title="EMA Length")
src_ema = input(close, title="EMA Source")
out_ema = ta.ema(src_ema, len_ema)

typeMA = input("SMA", title="Method")
smoothingLength = input(5, title="Length")

var float smoothingLine = na
if (typeMA == "SMA")
    smoothingLine := ta.sma(out_ema, smoothingLength)
else if (typeMA == "EMA")
    smoothingLine := ta.ema(out_ema, smoothingLength)

// MACD
fast_length = input(title="Fast Length", defval=9)
slow_length = input(title="Slow Length", defval=17)
src_macd = input(title="Source", defval=close)
signal_length = input.int(title="Signal Smoothing", minval=1, maxval=50, defval=9)
sma_source = input.string(title="Oscillator MA Type", defval="EMA", options=["SMA", "EMA"])
sma_signal = input.string(title="Signal Line MA Type", defval="EMA", options=["SMA", "EMA"])

fast_ma = sma_source == "SMA" ? ta.sma(src_macd, fast_length) : ta.ema(src_macd, fast_length)
slow_ma = sma_source == "SMA" ? ta.sma(src_macd, slow_length) : ta.ema(src_macd, slow_length)
macd = fast_ma - slow_ma
signal = sma_signal == "SMA" ? ta.sma(macd, signal_length) : ta.ema(macd, signal_length)
hist = macd - signal

// Condiciones de compra y venta
longCondition = (out_ema > basis) and (macd > signal) and (signal > 0)
shortCondition = (out_ema < basis) and (macd < signal) and (signal < 0)

// Variables de estado
var bool longExecuted = na
var bool shortExecuted = na

// Estrategia
if (longCondition and not longExecuted)
    strategy.entry("Long", strategy.long)
    longExecuted := true
    shortExecuted := na
if (shortCondition and not shortExecuted)
    strategy.entry("Short", strategy.short)
    shortExecuted := true
    longExecuted := na

// Take Profit y Stop Loss para Compras y Ventas Cortas
strategy.exit("Take Profit/Close Long", from_entry="Long", profit=takeProfitTicks, loss=stopLossTicks)
strategy.exit("Take Profit/Close Short", from_entry="Short", profit=takeProfitTicks, loss=stopLossTicks)

// Cierre de posiciones cuando la dirección cambia
if ((out_ema < basis) and (macd < signal))
    strategy.close("Long")
    longExecuted := na
if ((out_ema > basis) and (macd > signal))
    strategy.close("Short")
    shortExecuted := na

// Plots
plot(basis, "BB Basis", color=#FF6D00)
plot(upper, "BB Upper", color=color.new(#2962FF, 0.5))
plot(lower, "BB Lower", color=color.new(#2962FF, 0.5))

plot(smoothingLine, title="Smoothing Line", color=#f37f20, linewidth=2)

hline(0, "Zero Line", color=color.new(#787B86, 50))
plot(hist, title="Histogram", style=plot.style_columns, color=(hist >= 0 ? (hist[1] < hist ? color.green : color.red) : (hist[1] < hist ? color.red : color.green)))
plot(macd, title="MACD", color=color.blue)
plot(signal, title="Signal", color=color.orange)