Dynamic RSI Trading Strategy

Overview
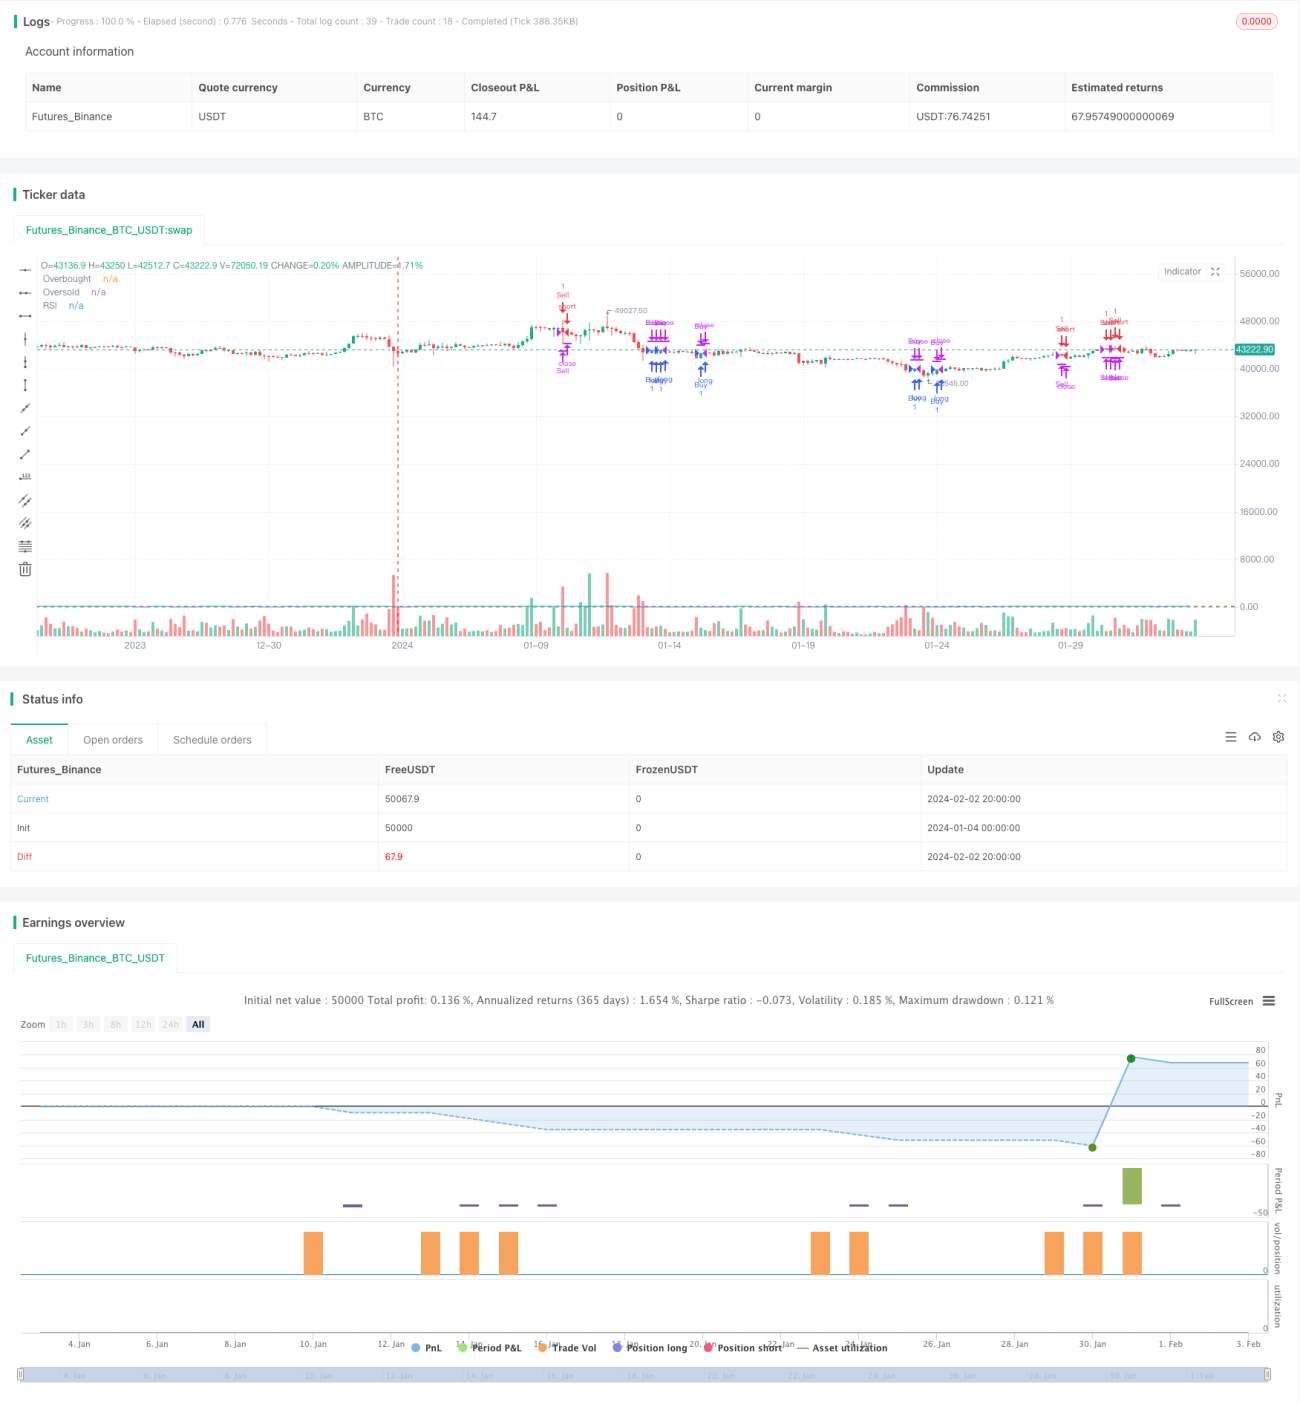
This strategy builds a trading system using RSI indicator to determine overbought and oversold levels, together with dynamic trailing stop loss and profit target exit. It goes short when RSI crosses above overbought level and goes long when RSI crosses below oversold level. Trailing stop loss and profit target exit are used to close positions.
Strategy Logic
This strategy uses 14-period RSI indicator to judge market technical patterns. RSI reflects the ratio of rising and falling power over a period of time, to tell if the market is overbought or oversold. The RSI length here is 14. When RSI crosses above 70, the market is considered overbought, and we go short. When RSI crosses below 30, the market is considered oversold, and we go long.
In addition, this strategy uses dynamic trailing stop loss mechanism. When holding long position, trailing stop price is set at 97% of closing price. When holding short position, trailing stop price is 103% of closing price. This locks in most profits while avoiding being stopped out by market noise.
Finally, this strategy uses profit target exit. When position profit reaches 20%, it will be closed. This locks in some profits and avoids profit retracement.
Advantage Analysis
The advantages of this strategy include:
- Using RSI indicator to determine overbought/oversold market effectively
- Adopting dynamic trailing stop loss to control risk
- Setting proper profit target to lock in profits
- Clear logic and few parameters, easy to implement for live trading
- Easy to optimize parameters like RSI length, overbought/oversold levels, stop loss percentage etc.
Risk Analysis
Some risks of this strategy to note:
- Potential false signals from RSI, causing unnecessary losses
- Probability of stop loss being hit, enlarging losses
- Profit target set too low, unable to hold position long enough to earn adequate profits
To cope with these risks, optimizing RSI parameters, adjusting stop loss percentage, relaxing profit target requirements reasonably can help.
Optimization Directions
Some directions to optimize the strategy:
- Optimize RSI parameters and overbought/oversold judge standards to reduce false signals
- Add other indicator filters to avoid erroneous signals caused by single RSI
- Dynamically optimize profit target according to market conditions
- Incorporate trading volume indicators to avoid low volume false breakouts
- Introduce machine learning algorithms to auto-tune parameters
Summary
The strategy has clear logic of using RSI to determine overbought/oversold market, with dynamic stops and profit taking. Its pros are easy understanding and implementation, good risk control, and high extensibility. Next step is to enhance signal quality, auto-tune parameters etc to make strategy more intelligent.
- 1