概述
MACD 量能反转交易策略是一种通过结合移动平均收敛离差(MACD)指标和交易量数据来识别股价潜在反转点或者延续点的策略。该策略的名称反映了其利用 MACD 和量能的组合来检测反转形态的本质。它可以帮助交易员提高获利机会,同时利用交易量过滤掉虚假信号。
策略原理
核心部分:
MACD 指标用于识别趋势反转点。指标下行突破信号线时为看涨信号,上行突破时为看跌信号。
交易量用于确认 MACD 信号。只有在交易量明显上涨时,才会触发入场信号。这有助于过滤虚假信号。
采用止盈机制。当头寸达到预设盈利水平时止盈出场。
具体实现流程:
用自定义参数计算 MACD 指标及其信号线。
识别 MACD 下行突破信号线(熊信号),同时交易量较前一根K线大幅增加(量能放大)。作为看涨信号而做空。
识别 MACD 上行突破信号线(牛信号),同时交易量较前一根K线大幅增加(量能放大)。作为看跌信号而做多。
入场后的止盈水平设置为入场价乘以预设盈利比例,达到后自动止盈。
优势分析
通过结合 MACD 和交易量,可以过滤掉一些虚假信号,避免不必要的亏损。
MACD 能较好反映短期的超买超卖现象,辅以交易量的确认,能抓住反转机会。
采用标准化的 MACD 参数设置,方便用户使用。
可通过参数调整匹配不同品种和交易风格。
风险分析
MACD 是滞后指标,存在一定迟滞。突破信号出现时,行情可能已经发生一定幅度的变动。
交易量放大也可能出现误判。比如缺口行情,交易量上升可能是无效突破。
反弹的力度和时间难以预测,即使短线获利也可能被重新推高或推低。
解决方法:
结合更多技术指标,如布林带、RSI等判断 MACD 信号的可靠性。
优化 MACD 参数使其更贴近当前市场特征。
采用保守止损,防止亏损进一步扩大。
优化方向
根据交易品种和周期优化 MACD 参数组合,提高指标的准确率。
添加更多技术指标进行组合,如 KDJ、布林带等以提高胜率。
对交易量条件可以设置动态的放大系数,使其更适应市场变化。
优化止盈回撤比来提高盈利水平。
总结
MACD 量能反转交易策略通过在 MACD 反转信号出现时需额外的交易量确认,能够提高信号的准确度,有助于把握关键的反转点,同时避免因虚假信号而造成不必要的损失。策略简单明了,容易掌握,有一定的实盘指导意义。但交易者仍需要在实盘中结合更多指标来验证信号以控制风险。通过不断的优化测试和风险控制,该策略可以获得稳定的超额收益。
/*backtest
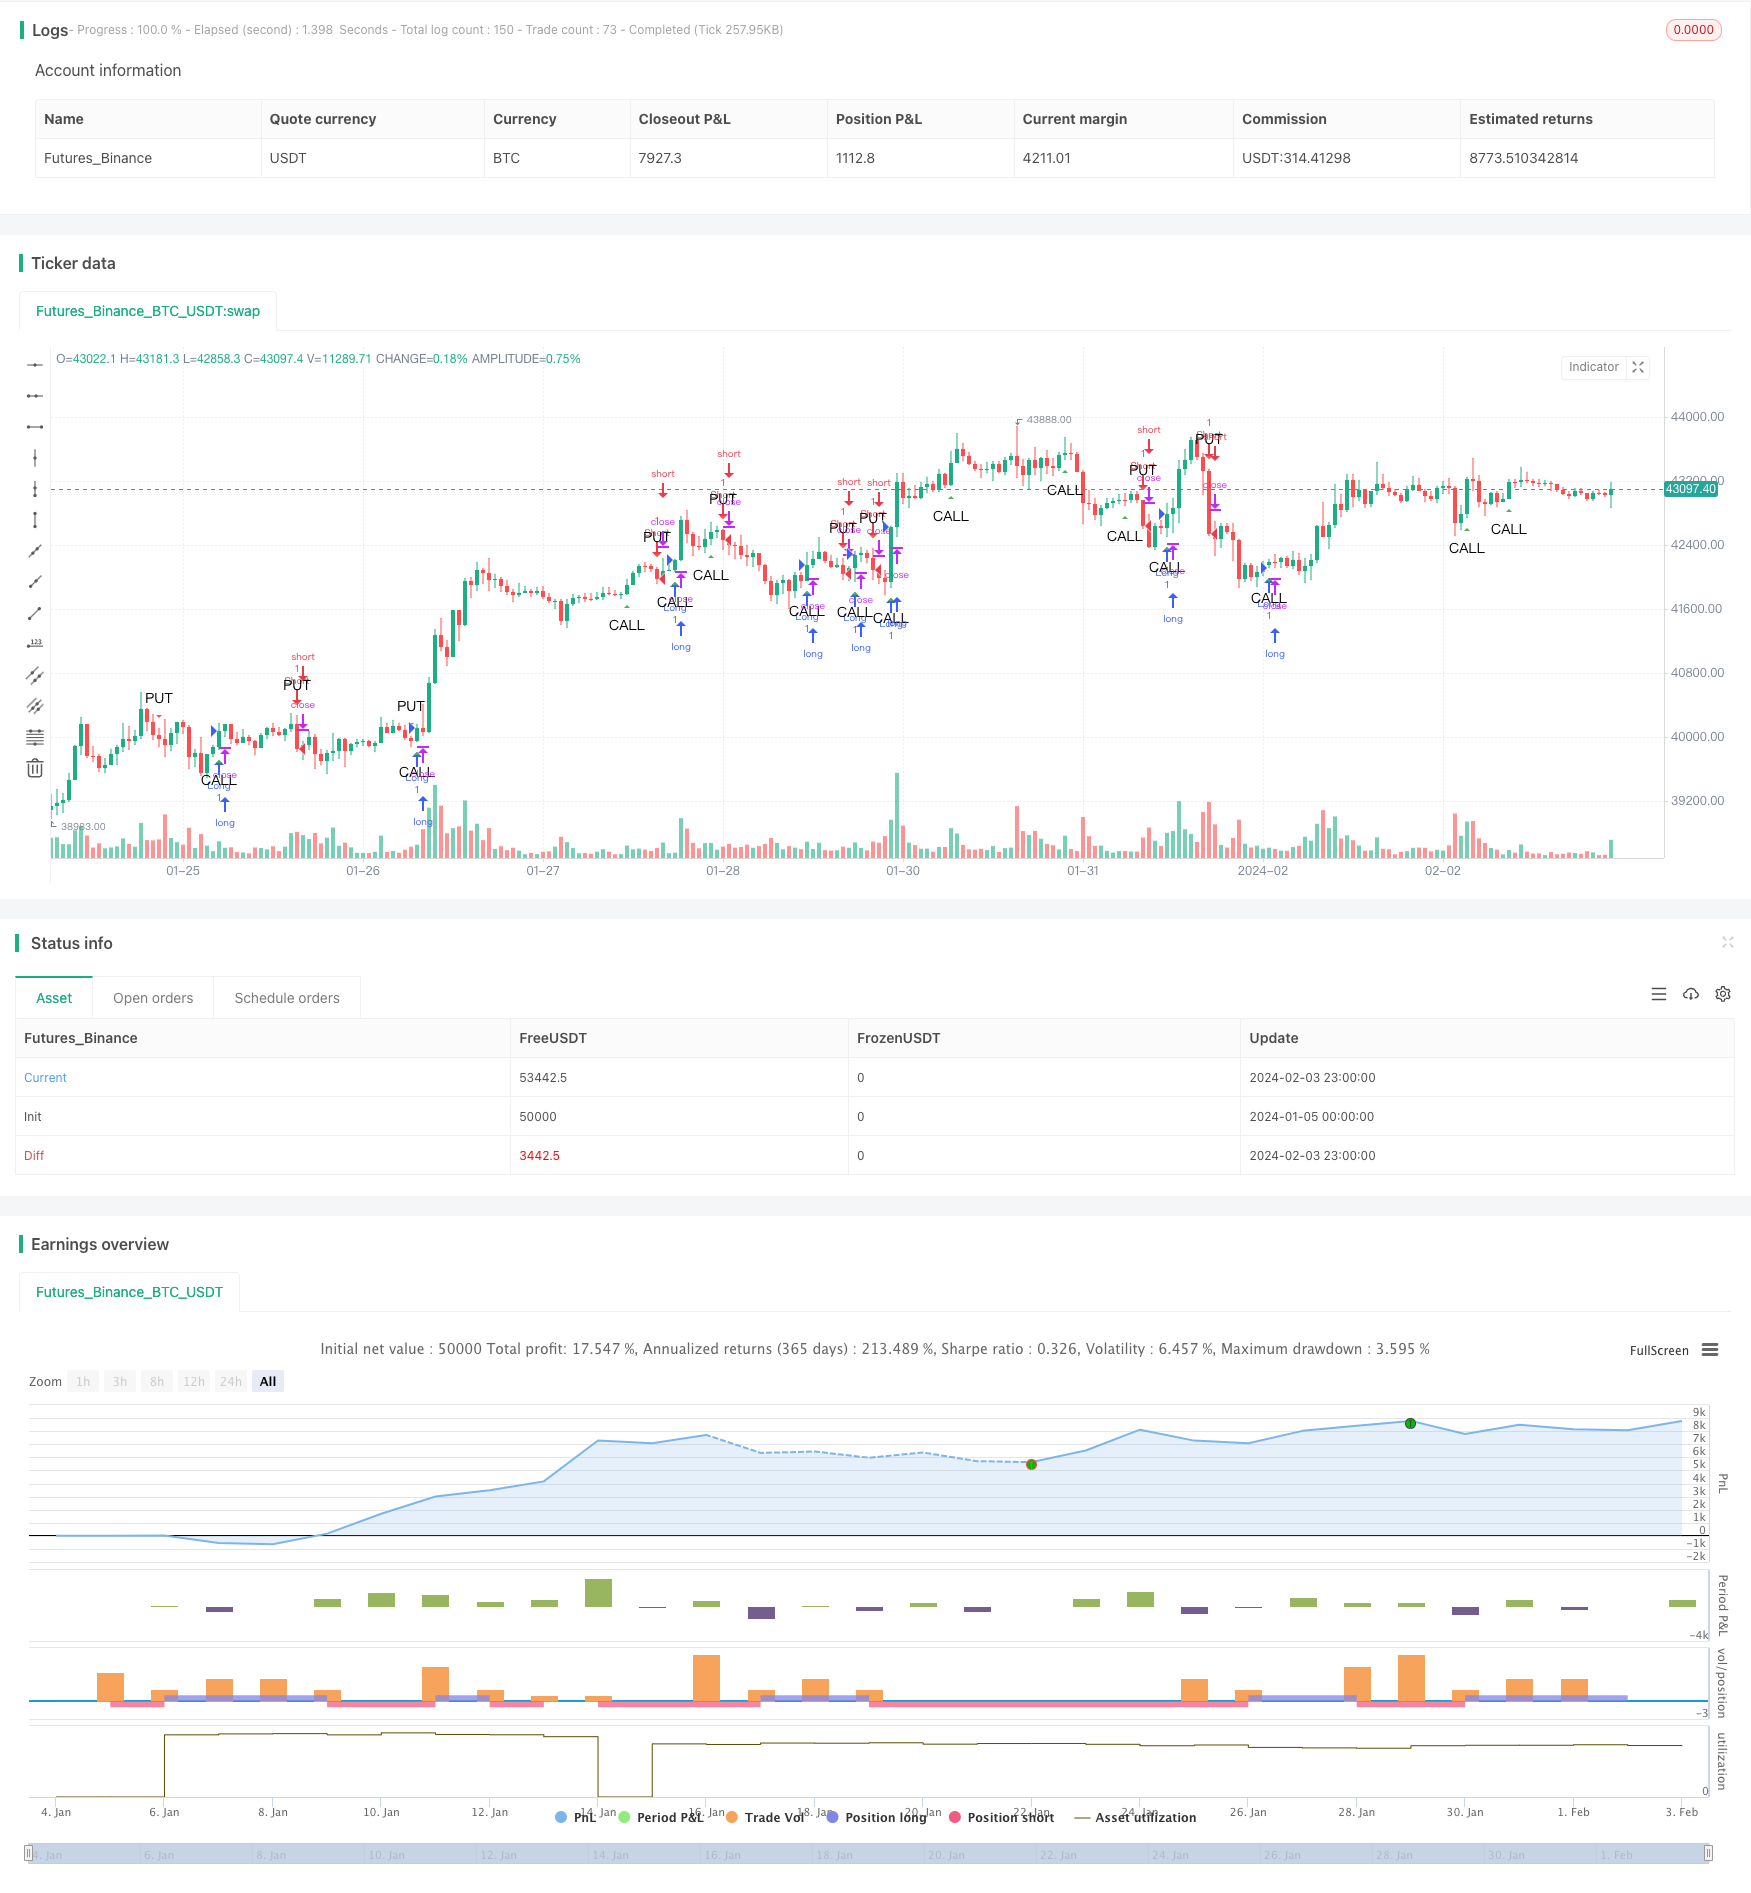
start: 2024-01-05 00:00:00
end: 2024-02-04 00:00:00
period: 1h
basePeriod: 15m
exchanges: [{"eid":"Futures_Binance","currency":"BTC_USDT"}]
*/
//@version=5
strategy("MACD Anti-Pattern Detector with Volume", shorttitle="MACD-APD-Vol", overlay=true)
// MACD settings
fastLength = input(3, title="Fast Length")
slowLength = input(10, title="Slow Length")
signalSmoothing = input(16, title="Signal Smoothing")
takeProfitPct = input(10.0, title="Take Profit (%)") / 100
volumeMultiplier = input(1.0, title="Volume Multiplier")
[macd, signal, _] = ta.macd(close, fastLength, slowLength, signalSmoothing)
// Detect anti-patterns with volume confirmation
bullishAntiPattern = ta.crossunder(macd, signal) and volume > volume[1] * volumeMultiplier
bearishAntiPattern = ta.crossover(macd, signal) and volume > volume[1] * volumeMultiplier
// Entry conditions
if (bullishAntiPattern)
strategy.entry("Short", strategy.short)
if (bearishAntiPattern)
strategy.entry("Long", strategy.long)
// Take profit conditions
strategy.exit("Take Profit Long", "Long", limit=strategy.position_avg_price * (1 + takeProfitPct))
strategy.exit("Take Profit Short", "Short", limit=strategy.position_avg_price * (1 - takeProfitPct))
// Highlight anti-patterns
plotshape(series=bullishAntiPattern, title="Bullish Anti-Pattern", style=shape.triangledown, location=location.abovebar, color=color.red, size=size.small, text="PUT")
plotshape(series=bearishAntiPattern, title="Bearish Anti-Pattern", style=shape.triangleup, location=location.belowbar, color=color.green, size=size.small, text="CALL")