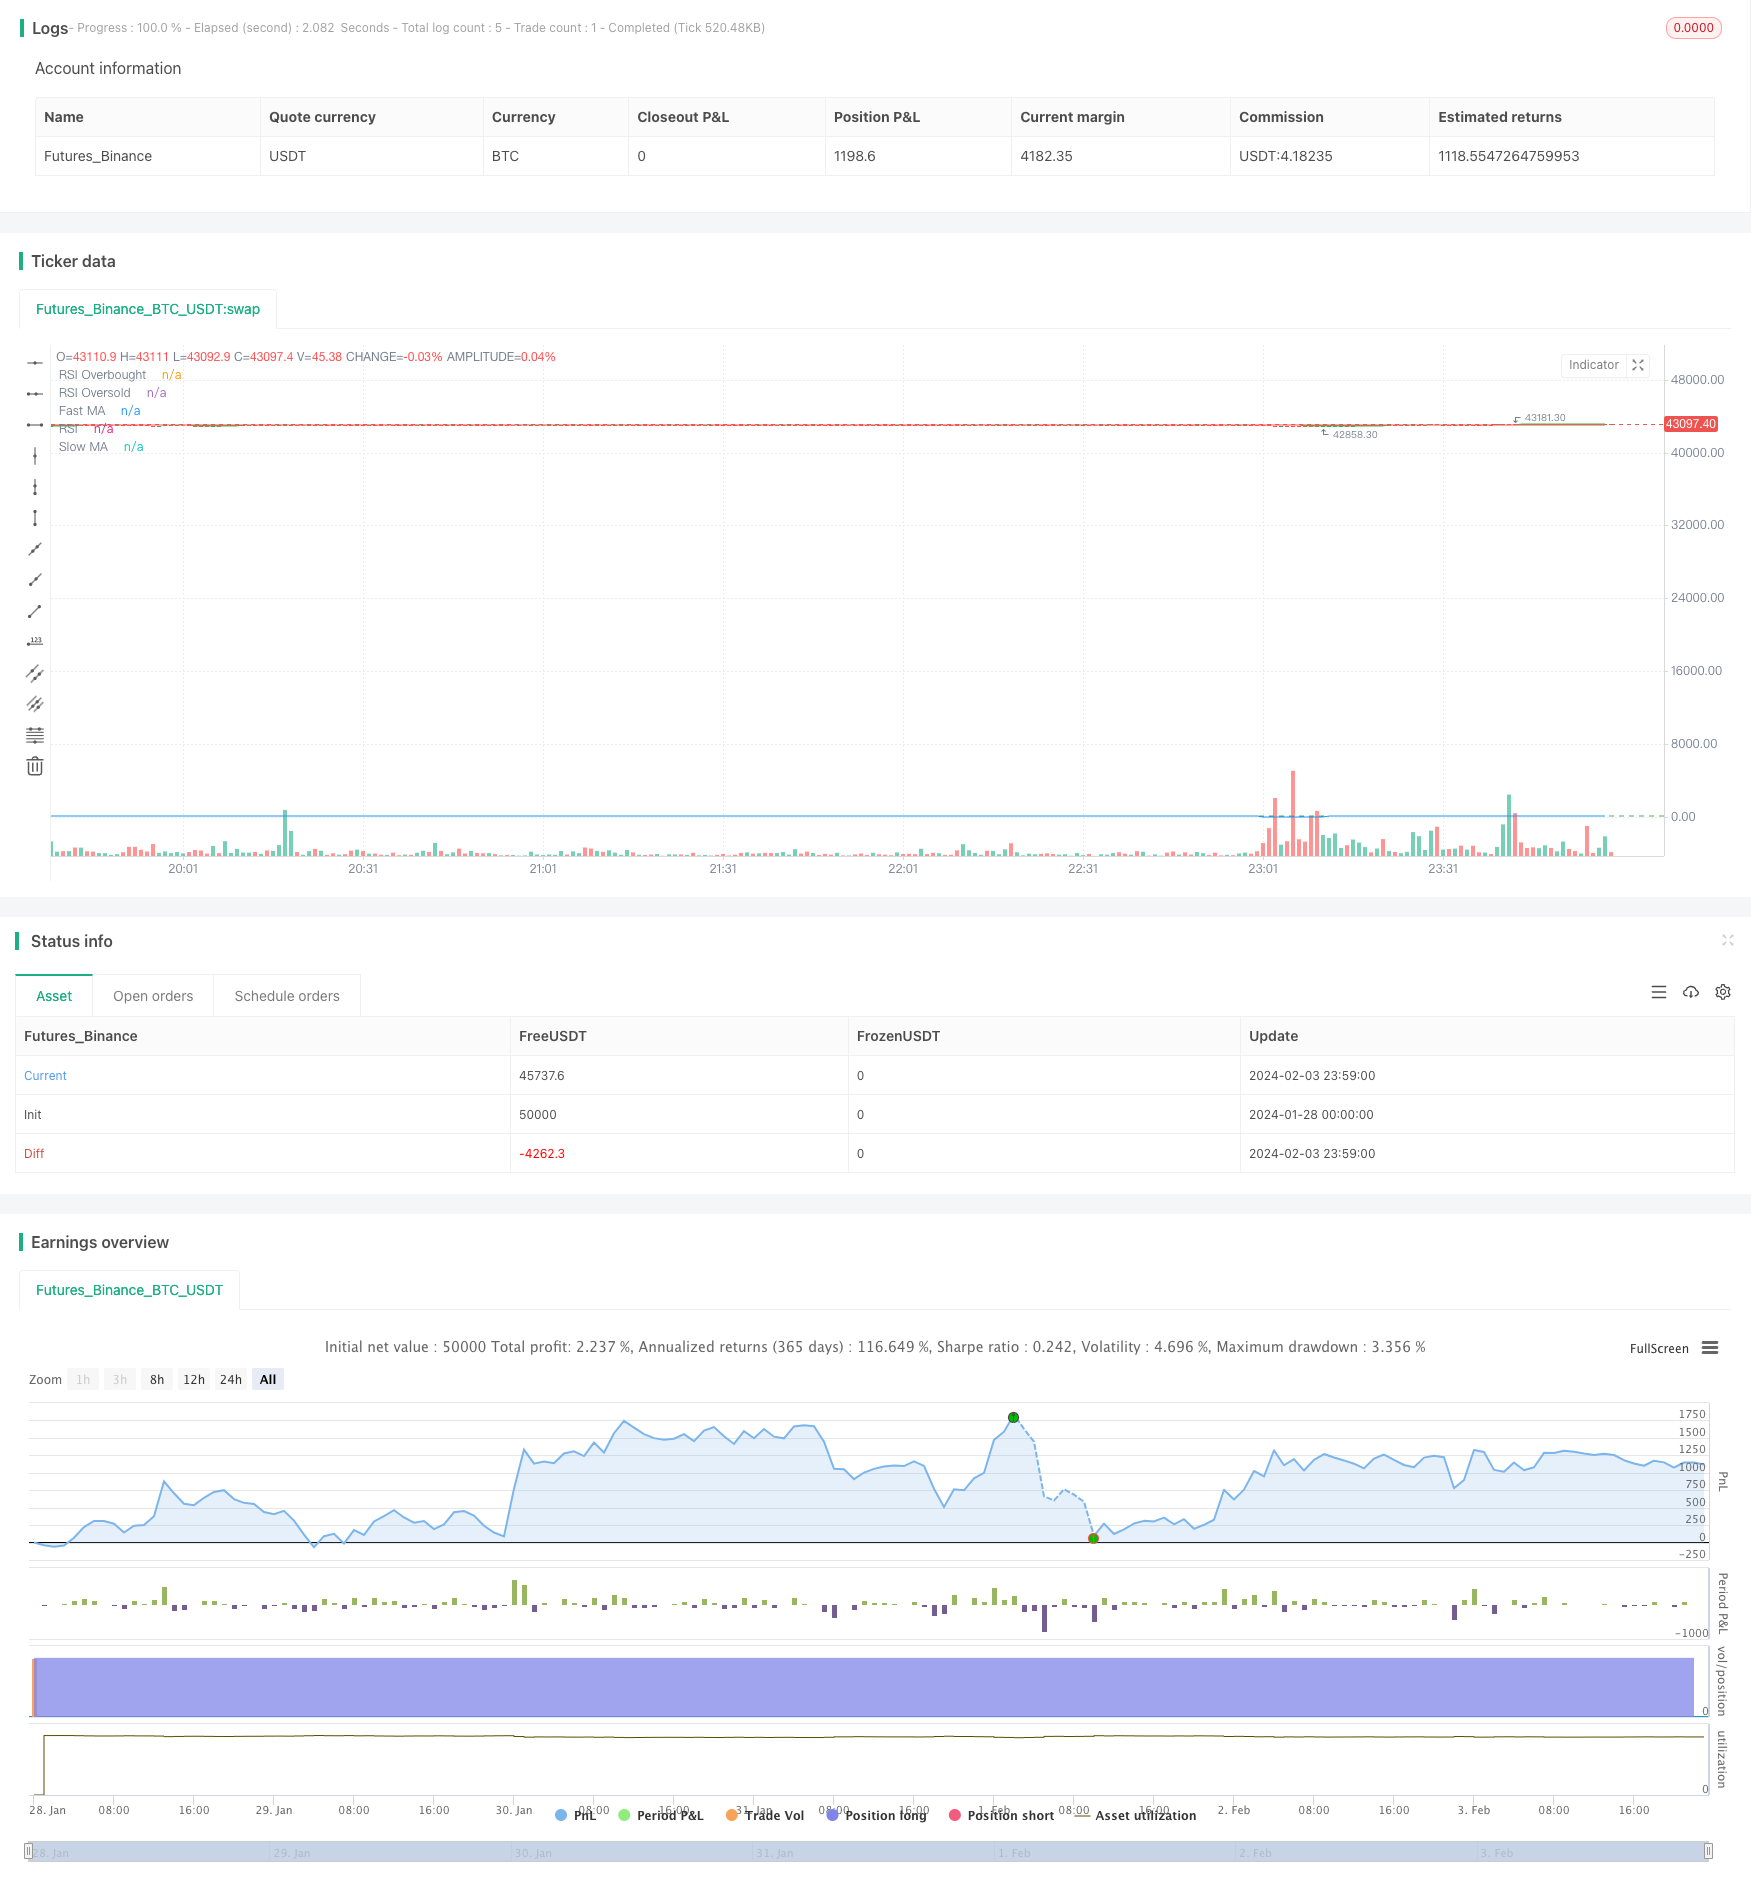
The Moving Average and RSI Crossover Strategy is a quantitative trading strategy that combines moving averages and the Relative Strength Index (RSI) indicator. The strategy generates trading signals based on the crossover of a fast moving average (e.g. 10-day MA) and a slow moving average (e.g. 50-day MA), as well as overbought/oversold levels in the RSI indicator. Specifically, when the fast MA crosses above the slow MA, while the RSI is below the oversold level, a buy signal is generated. When the fast MA crosses below the slow MA, while the RSI is above the overbought level, a sell signal is triggered.
The core idea behind this strategy is to combine trend following and overbought/oversold analysis to identify market entry and exit points. The moving average crossover reflects changes in the short-term and long-term trends. The RSI indicator determines if the market is in overbought or oversold territory. The strategy generates trade signals by analyzing the crossover between the two moving averages and value of the RSI.
Specifically, the crossing of the fast MA above and below the slow MA indicates the change in direction of the short-term trend. When the fast MA crosses above the slow MA, it signals an upside breakout in the short-term trend. When it crosses below, it signals a downside breakdown. The RSI indicator determines whether the market is currently overbought or oversold. An RSI level above the overbought threshold signals the market may be overbought, favoring bearish positions. An RSI level below the oversold threshold signals the market may be oversold, favoring bullish positions.
The strategy combines these indicators and generates a buy signal when the fast MA crosses above the slow MA, while the RSI is below oversold level. This signals both the short and long term trends are turning favorable, while the RSI low indicates the market is oversold presenting an opportunity to go long. A sell signal is triggered when the fast MA crosses below the slow MA, while the RSI is above the overbought level. Both trends now signal a downside, while the high RSI signals elevated risk suggesting to close out long exposure.
By combining trend analysis and overbought/oversold analysis, this strategy is able to identify turning points and generate profitable trade signals over the short-term.
The biggest advantage of this strategy is it incorporates both dimensions of trend and overbought/oversold analysis to gauge market conditions, avoiding missed trade opportunities.
Firstly, the golden/dead cross of moving averages offers a clear way to determine relationships between the short and long term trends. Combining crossovers provides more timely signals compared to just using individual short and long term averages.
Secondly, the overbought/oversold analysis from RSI helps filter out false breakouts. In actual trading, prices may make short-term fluctuations that do not necessarily represent real trend changes. The RSI helps judge whether this short-term price action is just normal oscillations or abnormal ones needing attention. Therefore, incorporating RSI eliminates some misleading trade signals.
Lastly, this strategy only triggers around trend turning points, avoiding ineffective trades. Quantitative strategies often face repeated losses opening positions during range-bound periods. But this strategy has clear rules on when to enter based on the buy/sell signals, reducing unnecessary trade frequencies.
In summary, the Moving Average and RSI Crossover Strategy combines both trend following and overbought/oversold analysis, offering reliable trade signals ideal for short-term trading.
While the strategy has multiple strengths, there are still risks to closely monitor:
Firstly whipsaw risk, as sharp volatile moves may frequently hit stop losses prematurely exiting trades. The strategy is designed for short-term trades, so will not hold positions extensively. But outlier moves can easily knock out stops.
Secondly, overly short moving average periods translate into very high trade frequencies. This strains trading costs and mental discipline. Trading too often not only accumulates fees, but risks making execution mistakes adding up losses.
Lastly, extensive optimization and robustness checks are imperative for parameter settings, or else trade signals may fail. For example, inappropriate overbought/oversold thresholds lead to inaccurate signal generation. Proper backtesting and out-of-sample testing is critical.
These risks can be addressed via adjustments like longer holding periods, stop loss optimization, and psychological discipline. Extensive verification of the strategy is also necessary to ensure stability and profitability.
There remains room for improving this strategy, primarily:
Firstly, incorporating adaptive moving averages or triple exponential moving averages so the system responds faster to the latest prices, improving timeliness of signals.
Secondly, adding volatility metrics like ATR to dynamically adjust stop loss levels thereby reducing whipsaw stop outs. This helps control risks.
Thirdly, researching optimal RSI parameters across market conditions (breakouts, pullbacks etc) so overbought/oversold analysis fits the current environment better, enhancing adaptability.
Fourthly, applying machine learning techniques to filter out erroneous signals, making the strategy more intelligent. This boosts accuracy.
Through these optimization avenues, further performance gains are possible while controlling for downside risks. This marks an important direction for future research.
The Moving Average and RSI Crossover strategy exemplifies a typical approach combining trend following and indicator analysis for short-term trading. It captures market turning points to take advantage of short-term opportunities. RSI filters further improve robustness of signals generated. The easy-to-understand logic with clear rules also makes this strategy ideal for beginners to quantitative trading.
However, risks like whipsaws and high trading costs from frequency of signals need addressing through parameter tuning, stop losses, and psychological discipline. Further performance gains are possible by incorporating adaptive averages, risk metrics, and machine learning filters.
Overall, by blending trend and momentum factors, this strategy offers simplicity in design but also extensibility through numerous optimization pathways. It warrants consideration as a foundational quantitative trading strategy.
/*backtest start: 2024-01-28 00:00:00 end: 2024-02-04 00:00:00 period: 1m basePeriod: 1m exchanges: [{"eid":"Futures_Binance","currency":"BTC_USDT"}] */ //@version=5 strategy("MA and RSI Crossover Strategy", shorttitle="MA_RSI_Strategy", overlay=true) // 输入参数 fastLength = input(10, title="Fast MA Length") slowLength = input(50, title="Slow MA Length") rsiLength = input(14, title="RSI Length") rsiOverbought = input(70, title="RSI Overbought Level") rsiOversold = input(50, title="RSI Oversold Level") // 计算移动平均线 fastMA = ta.sma(close, fastLength) slowMA = ta.sma(close, slowLength) // 计算相对强弱指数 rsiValue = ta.rsi(close, rsiLength) // 定义买卖信号 buySignal = ta.crossover(fastMA, slowMA) and rsiValue < rsiOversold sellSignal = ta.crossunder(fastMA, slowMA) and rsiValue > rsiOverbought // 策略逻辑 strategy.entry("Buy", strategy.long, when=buySignal) strategy.close("Buy", when=sellSignal) // 绘制移动平均线 plot(fastMA, color=color.green, title="Fast MA") plot(slowMA, color=color.red, title="Slow MA") // 绘制RSI hline(rsiOverbought, "RSI Overbought", color=color.red) hline(rsiOversold, "RSI Oversold", color=color.green) plot(rsiValue, color=color.blue, title="RSI") // 在买入信号处标记买入点 plotshape(series=buySignal, title="Buy Signal", color=color.green, style=shape.triangleup, location=location.belowbar, size=size.huge)template: strategy.tpl:40:21: executing "strategy.tpl" at <.api.GetStrategyListByName>: wrong number of args for GetStrategyListByName: want 7 got 6