概述
本文主要介绍了一个基于RSI和WMA的量化交易策略。该策略通过计算RSI和WMA的值,并设定买入和卖出信号的条件,以发现股票价格反转点,实现低买高卖的目的。
策略原理
该策略的核心指标包括RSI和WMA。RSI(Relative Strength Index)是一种波动指标,用于衡量股票最近上涨和下跌速度的变化。WMA(Weighted Moving Average)是一种加权移动平均线。
策略的买入信号是当RSI上穿WMA时生成,这表明股票价格反转,有可能开始上涨。策略的卖出信号是当RSI下穿WMA时生成,说明价格反转,有可能开始下跌。
具体来说,策略首先计算14日RSI的值,然后计算45日WMA的值。如果RSI上穿WMA,则生成买入信号;如果RSI下穿WMA,则生成卖出信号。通过RSI和WMA的组合,可以更准确地捕捉到价格的反转点。
策略优势
该策略具有以下几个优势:
- 策略信号明确,买卖规则清晰,容易实施。
- RSI和WMA指标互相验证,可以减少假信号。
- RSI的参数可以调整,适应不同周期的股票。
- WMA参数也可以调整,CAPTURE不同级别的价格趋势。
- 代码简洁,容易理解,便于后期优化。
策略风险
该策略也存在以下风险:
- 股票价格可能出现剧烈波动,导致止损。
- RSI和WMA的参数需要反复测试优化,不当设置可能失效。
- 交易频率可能过高,增加交易成本和滑点成本。
- 无法有效过滤整体市场 SYSTEMIC风险。
这些风险可以通过参数调整、止损设置、过滤市场风险等方法来规避。
优化方向
该策略可以从以下几个方面进行优化:
- 测试不同天数的RSI和WMA参数,寻找最优参数。
- 加入成交量指标进行过滤,避免虚假信号。
- 设置可变止损线,当价格向不利方向运行时止损。
- 结合其他指标如MACD、BOLL进行过滤,提高信号质量。
- 优化开平仓逻辑,改进入场和出场策略。
总结
本策略整合运用RSI和WMA两个指标,通过捕捉它们的交叉形成交易信号,实现简单有效的量化交易。该策略易于实施,有一定的顺市效果。通过继续测试和优化参数,并设置恰当的止损机制,可以进一步提高策略的稳定性和盈利能力。
策略源码
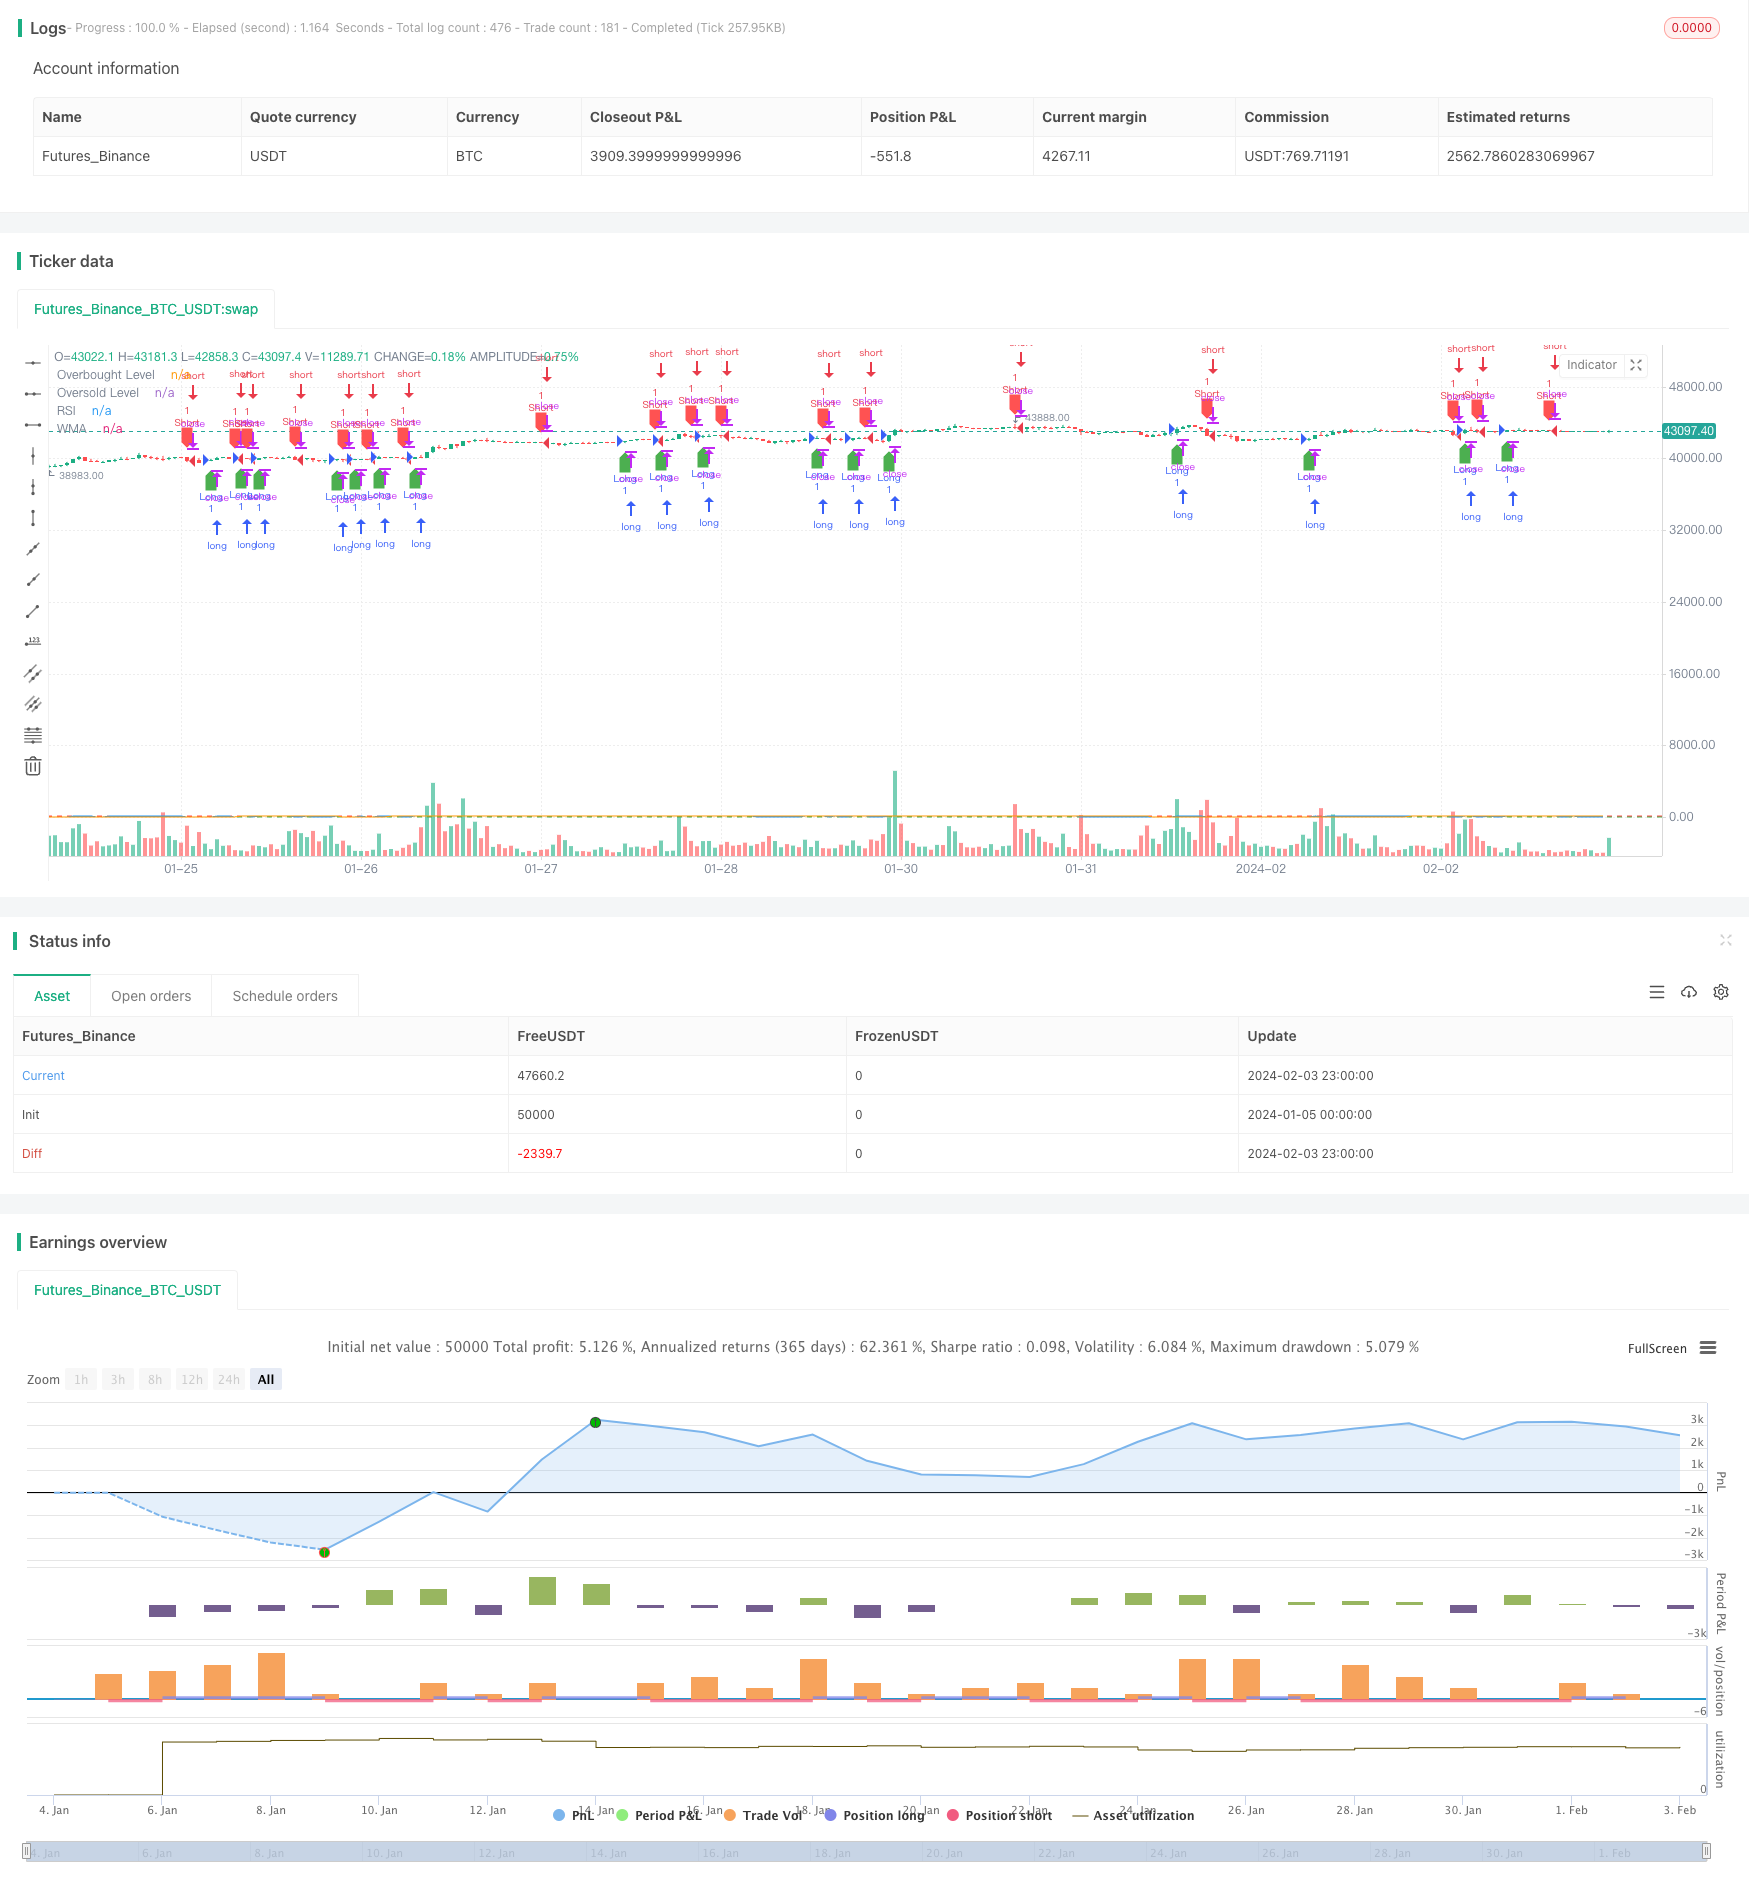
/*backtest
start: 2024-01-05 00:00:00
end: 2024-02-04 00:00:00
period: 1h
basePeriod: 15m
exchanges: [{"eid":"Futures_Binance","currency":"BTC_USDT"}]
*/

//@version=5
strategy("RSI WMA Strategy", overlay=true)

// Input parameters
rsiLength = input(14, title="RSI Length")
wmaLength = input(45, title="WMA Length")

// Calculate RSI and WMA
rsiValue = ta.rsi(close, rsiLength)
wmaValue = ta.wma(rsiValue, wmaLength)

// Define overbought and oversold levels for RSI
overboughtLevel = 70
oversoldLevel = 30

// Strategy logic
longCondition = ta.crossover(rsiValue, wmaValue)
shortCondition = ta.crossunder(rsiValue, wmaValue)

// Execute trades
if (longCondition)
    strategy.entry("Long", strategy.long, comment="BUY")
if (shortCondition)
    strategy.entry("Short", strategy.short, comment="SELL")

// Plotting for visualization
plot(rsiValue, title="RSI", color=color.blue)
plot(wmaValue, title="WMA", color=color.orange)
hline(overboughtLevel, "Overbought Level", color=color.red)
hline(oversoldLevel, "Oversold Level", color=color.green)

// Plot buy and sell signals on the chart
plotshape(series=longCondition, title="Buy Signal", color=color.green, style=shape.labelup, location=location.belowbar)
plotshape(series=shortCondition, title="Sell Signal", color=color.red, style=shape.labeldown, location=location.abovebar)