概述
本策略名为“Relative Strength Index长线量化策略”,简称RSI长线策略。该策略通过计算一定周期内价格涨幅和跌幅的移动平均线,构建RSI技术指标,并设定超买超卖线,来判断行情时点。当RSI低于设定的超卖线时,采取逐步建仓的方式进入长线持有。
策略原理
该策略的核心指标是相对强弱指数(RSI)。RSI指标通过比较一段时间内的平均涨幅和平均跌幅,来判断当前证券价格是否被高估或低估。其计算公式为:
RSI = 100 - 100 / (1 + UP / DOWN)
其中,UP是最近n天内收盘价上涨的平均幅度;DOWN是最近n天内收盘价下跌的平均幅度。指标以0-100区间震荡,超过70为超买区,低于30为超卖区。
该策略设置RSI参数Length=14,根据14天的收盘价计算RSI。并设置超卖线Rsvalue=40,即RSI低于40判定为超卖。当日RSI低于40时,打开买入窗口,采取逐步建仓策略,在超卖区间逐步买入,并设置最后平仓时间,超过平仓时间后全部卖出。
优势分析
该策略最大的优势在于,通过RSI指标判断市场时点,实现了对低价的捕捉。RSI低于40时为超卖状态,代表前期跌幅过大,存在反弹机会,这时逐步建仓,可以获得较好的成本。而RSI高于70时为超买状态,代表行情可能见顶,这时可以考虑逐步减仓。
另外,策略采取逐步建仓的方式,可以降低单次入场带来的风险。建仓窗口作为持仓高点,最后平仓时间作为持仓低点,实现了长线投资。
风险分析
该策略主要依赖RSI这一技术指标,存在一定的滞后性。特别是在行情突然变化时,RSI可能来不及给出反应。这时如盲目跟随RSI指标建仓,可能获利有限或增加亏损。
另外,策略给出的是probabilistic的交易信号。即使RSI低于40,也不意味着就100%存在反弹机会。建仓后价格再创新低的概率也是存在的。这时需要设置好止损策略,控制最大亏损。
优化方向
该策略可以在以下几个方面进行优化:
结合多个股票,进行组合交易。单一股票容易受特定事件影响,而组合可以分散个股风险。
加入止损策略,进一步控制风险。如加入跟踪止损,在价格继续下跌时停损exit。
优化建仓策略,如在超卖区间使用时间加权平均价逐步建仓,而不是全仓建立。
结合其他指标过滤信号,如量能指标、移动平均线等,避免盲目跟随RSI。
总结
本策略通过构建RSI指标判断超买超卖区间,在超卖区间逐步建立多头仓位,并设置最后平仓时间,实现长线持有。相比短线交易,该策略更适合作为长线量化投资工具。其优势在于低价捕捉和成本控制,而风险在于指标滞后性和信号误导。未来可通过组合优化、止损策略、建仓优化等多种方式进行改进。
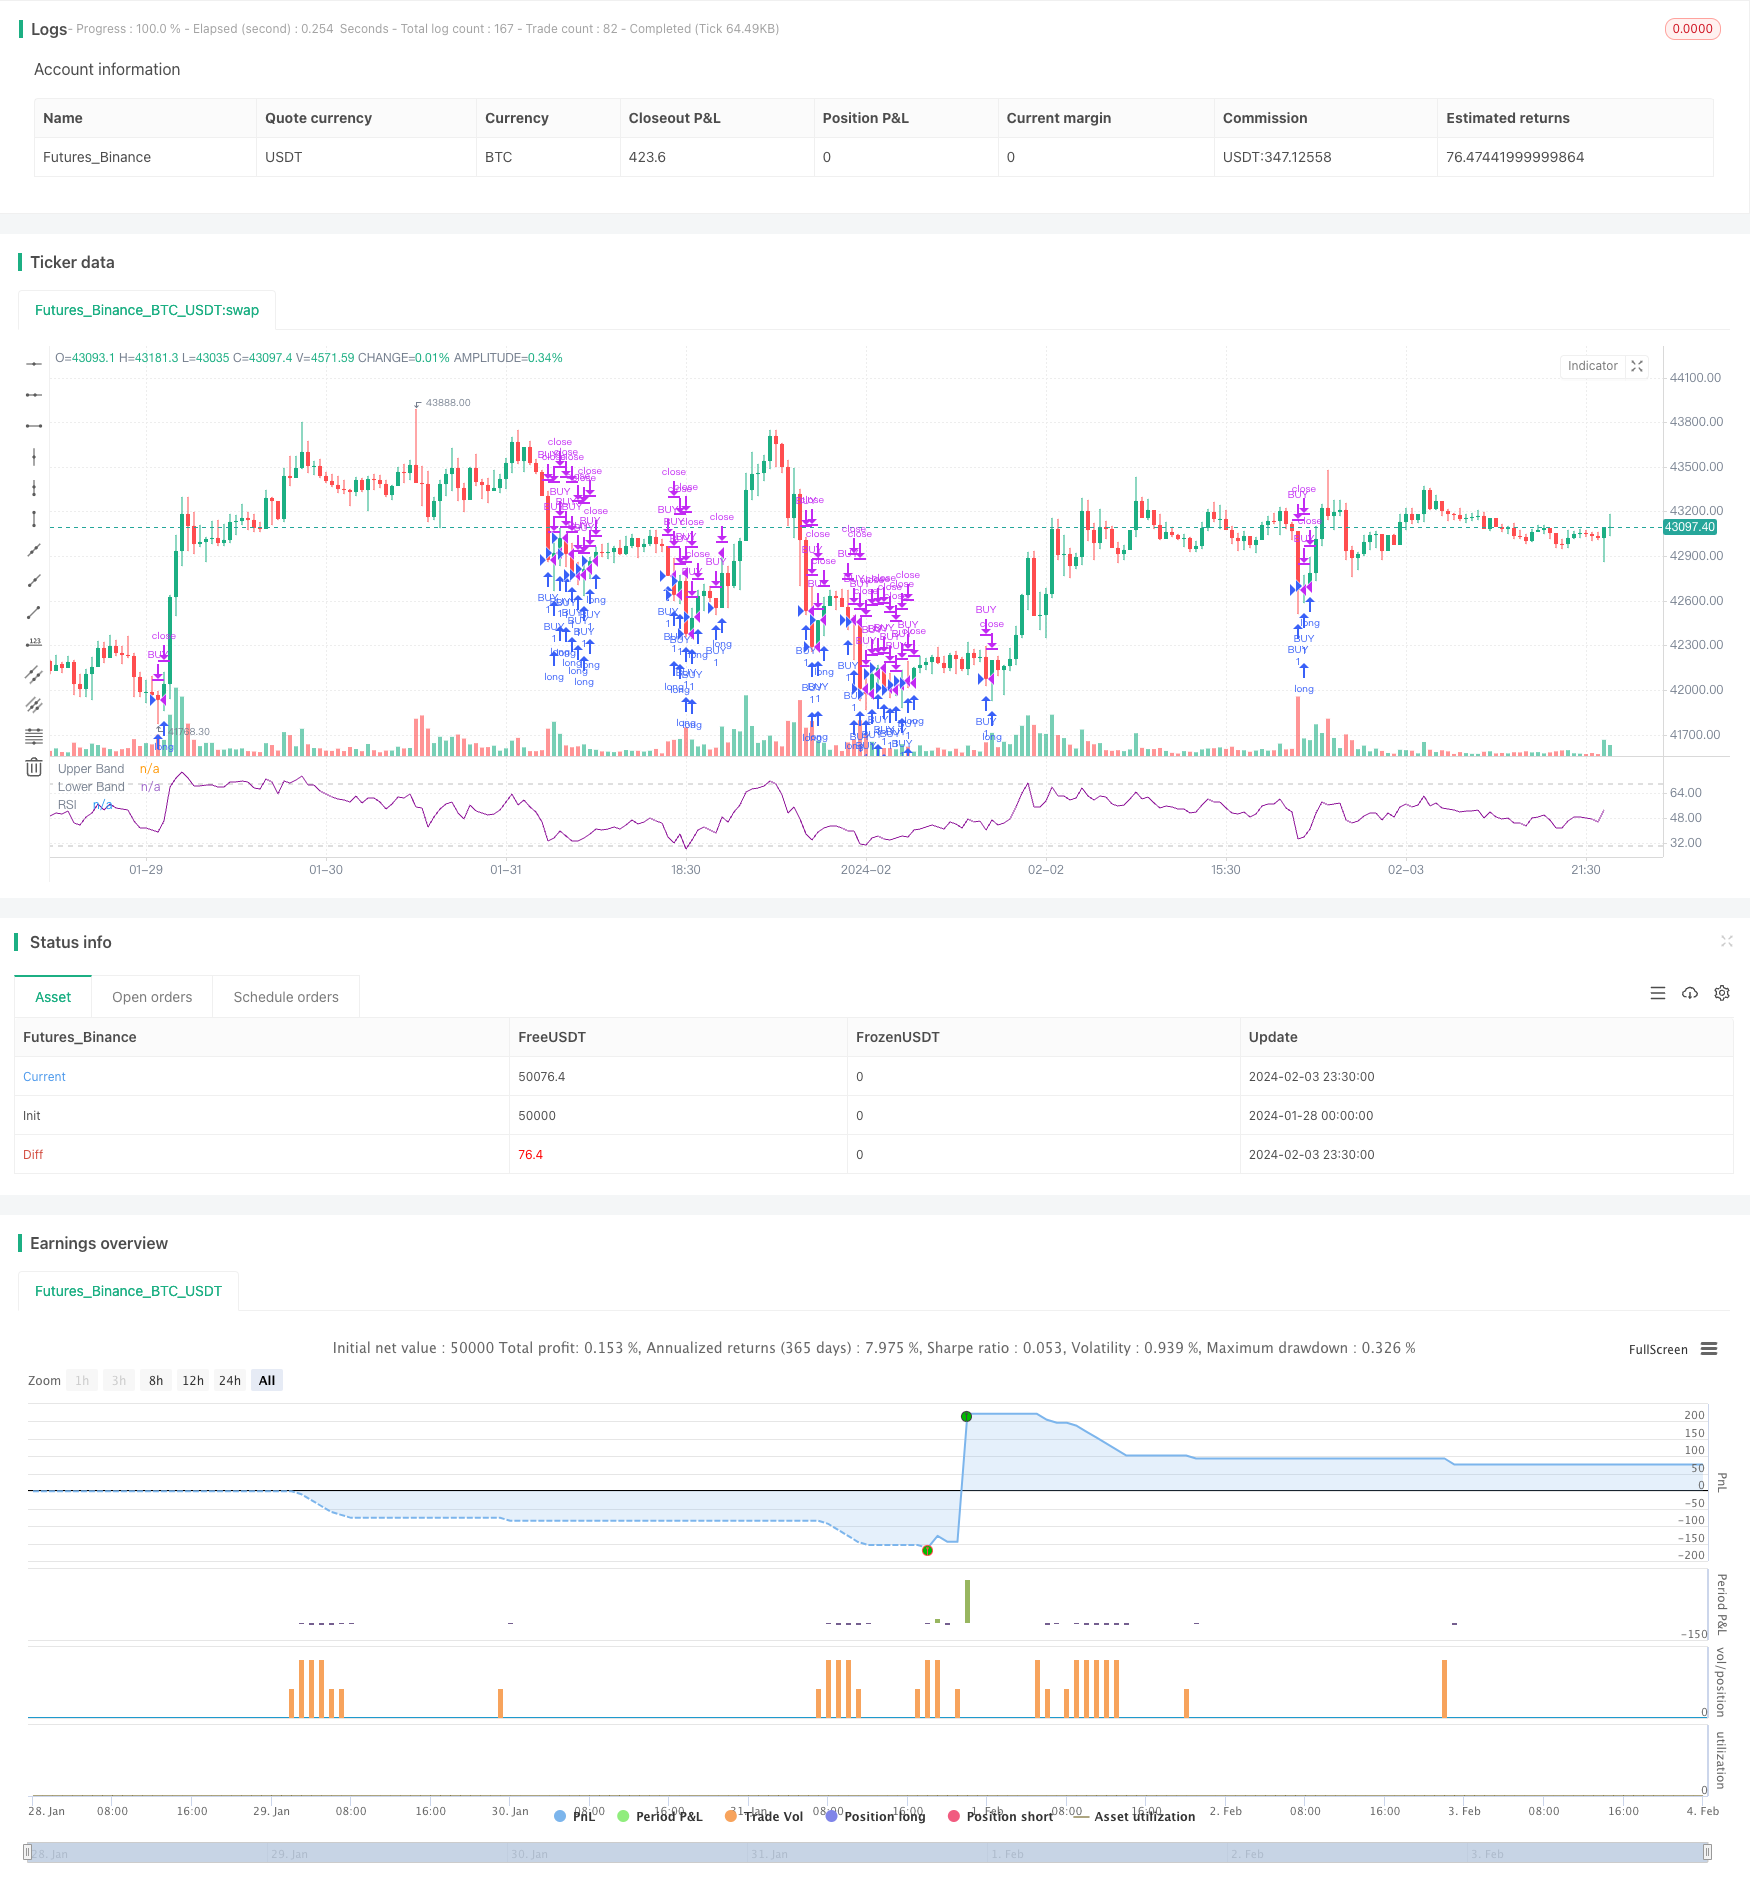
/*backtest
start: 2024-01-28 00:00:00
end: 2024-02-04 00:00:00
period: 30m
basePeriod: 15m
exchanges: [{"eid":"Futures_Binance","currency":"BTC_USDT"}]
*/

//@version=4
strategy(title="Relative Strength Index", shorttitle="RSI")
len = input(14, minval=1, title="Length")
src = input(close, "Source", type = input.source)
up = rma(max(change(src), 0), len)
down = rma(-min(change(src), 0), len)
rsi = down == 0 ? 100 : up == 0 ? 0 : 100 - (100 / (1 + up / down))
plot(rsi, "RSI", color=#8E1599)
band1 = hline(70, "Upper Band", color=#C0C0C0)
band0 = hline(30, "Lower Band", color=#C0C0C0)
fill(band1, band0, color=#9915FF, title="Background")
Rsvalue = input(defval = 40, title = "RSvalue", minval = 20, maxval = 75)


FromMonth = input(defval = 1, title = "From Month", minval = 1, maxval = 12)
FromDay   = input(defval = 1, title = "From Day", minval = 1, maxval = 31)
FromYear  = input(defval = 2015, title = "From Year", minval = 999)
ToMonth   = input(defval = 3, title = "To Month", minval = 1, maxval = 12)
ToDay     = input(defval = 1, title = "To Day", minval = 1, maxval = 31)
ToYear    = input(defval = 2022, title = "To Year", minval = 999)
start     = timestamp(FromYear, FromMonth, FromDay, 00, 00)
finish    = timestamp(ToYear, ToMonth, ToDay, 23, 59)
booking   = timestamp(ToYear, ToMonth, ToDay, 23, 59)

window()  => time >= start and time <= finish ? true : false
endtrade() => time >= booking ? true : false


longCondition = rsi< Rsvalue

if (longCondition)
    strategy.entry("BUY", strategy.long)
    strategy.close("BUY")