概述
本策略基于超趋势通道指标设计 Entries 和 Exits 信号,实现自动化量化交易。超趋势通道指标可明确突破点和支持阻力位,帮助判断趋势方向。本策略融合该指标的优势,进行长短双向交易。
策略原理
本策略使用 ATR 和唐奇安通道计算长短两个止损线。具体来说,通过 ATR 周期和 ATR 倍数参数计算 ATR 值,然后与最高价和最低价的平均值相加减,得到长短两个止损线。当收盘价从下向上突破长止损线时产生做多信号;当收盘价从上向下突破短止损线时产生做空信号。
做多做空后,会实时更新止损线,以锁定利润。新的止损线不会低于或高于之前值,从而避免止损被击穿。在止损线和之前止损线之间出现新高或新低时,更新止损线到最新价格。
优势分析
本策略最大的优势在于,超趋势通道指标能清晰判断趋势方向和关键支持阻力位。结合 ATR 动态止损,可以有效控制单笔损失。
具体来说,超趋势通道指标中的两个止损线,一个代表持仓成本,一个代表最近支撑或压力位。这为 Entries 和 Exits 提供了非常明确的依据。同时,止损线会实时更新,可以锁定利润,避免止损被击穿。
整体来说,本策略在确定趋势后及时 Entries,通过动态止损控制风险,是一种相对稳健的量化交易策略。
风险分析
本策略的主要风险在于,可能出现止损线被突破的情况。当价格剧烈波动时,新的止损线有可能低于或高于之前值,导致止损被击穿,增加损失。
此外,在震荡行情中,超趋势通道指标生成的 Entries 信号效果不佳,容易形成错误交易。这时需要人工干预,判断趋势后再启动策略。
优化方向
本策略可以从以下几个方面进行优化:
优化 ATR 周期和 ATR 倍数参数,找到最佳组合。可以通过回测不同参数,分析收益率、夏普比率等指标。
增加其他指标过滤,避免在震荡行情出错 Entries。可以考虑加入移动平均线、布林带等指标判断趋势方向。
结合量能指标优化止损位置。可以根据成交量突增的位置来调整止损线,进一步锁定利润。
增加机器学习模型进行参数自适应优化。可以利用 RNN、LSTM 等模型预测参数值,实现参数动态优化。
总结
本策略基于超趋势通道指标设计,判断趋势方向明确,具有较高的胜率。同时,应用 ATR 动态跟踪止损来控制单笔损失。通过参数优化、指标优化等手段可进一步增强策略效果。总体来说这是一种适合自动化量化交易的稳健策略。
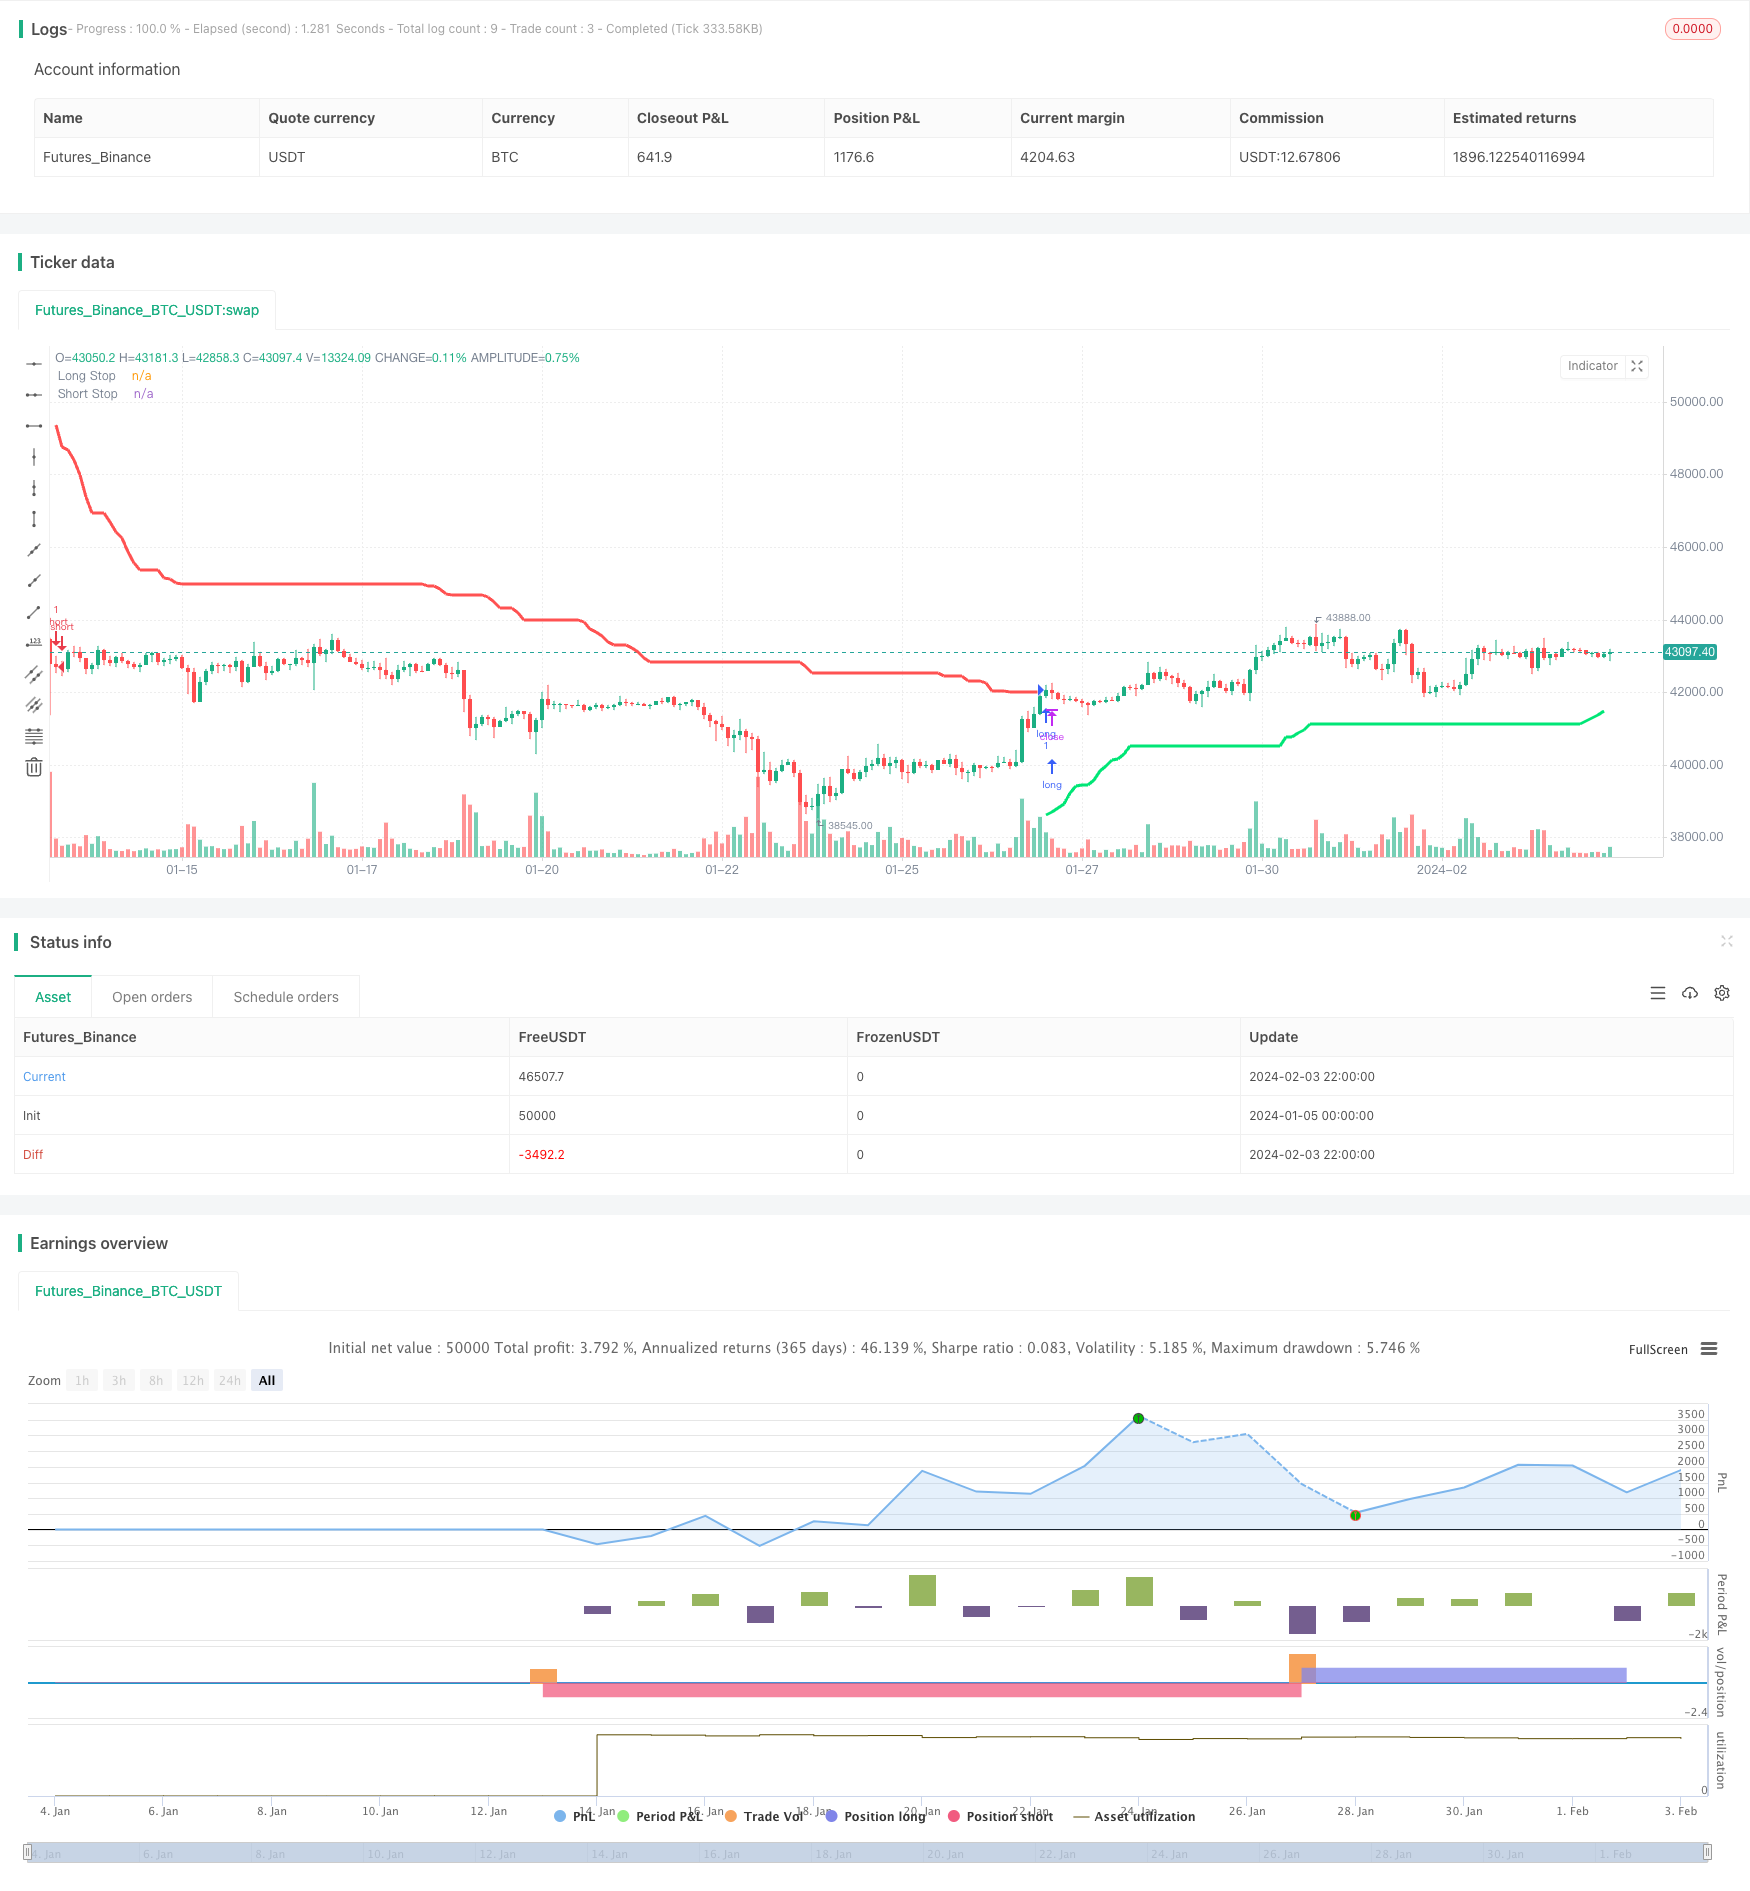
/*backtest
start: 2024-01-05 00:00:00
end: 2024-02-04 00:00:00
period: 2h
basePeriod: 15m
exchanges: [{"eid":"Futures_Binance","currency":"BTC_USDT"}]
*/

//@version=4
//EU ESCREVI ISSO TUDO, PARA FICAR BEM CLARO

strategy("SuperTrend Strategy", overlay=true)


//AQUI OS INPUTS PARA A SUPERTREND
length = input(title="ATR Period", type=input.integer, defval=7)
mult = input(title="ATR Multiplier", type=input.float, step=0.1, defval=7)
showLabels = input(title="Show Buy/Sell Labels ?", type=input.bool, defval=true)

//AQUI O CALCULO DO ATR STOPS
atr = mult * atr(length)


//AQUI A TRANSFORMAÇÃO DO ATR STOPS EM SUPERTREND
//-
//A LÓGICA PARA LONGSTOP
longStop = hl2 - atr
longStopPrev = nz(longStop[1], longStop)
longStop := close[1] > longStopPrev ? max(longStop, longStopPrev) : longStop

//A LÓGICA PARA SELLSTOP
shortStop = hl2 + atr
shortStopPrev = nz(shortStop[1], shortStop)
shortStop := close[1] < shortStopPrev ? min(shortStop, shortStopPrev) : shortStop


//DIREÇÃO DO INDICADOR
dir = 1
dir := nz(dir[1], dir)
dir := dir == -1 and close > shortStopPrev ? 1 :
   dir == 1 and close < longStopPrev ? -1 : dir


//DEFININDO AS CORES DAS LINHAS DA SUPERTREND
longColor = color.lime
shortColor = color.red


//PLOTANDO NO GRÁFICO A SUPERTREND E A ESTRATÉGIA
plot(dir == 1 ? longStop : na, title="Long Stop", style=plot.style_linebr, linewidth=3, color=longColor)
buySignal = dir == 1 and dir[1] == -1
plot(dir == 1 ? na : shortStop, title="Short Stop", style=plot.style_linebr, linewidth=3, color=shortColor)
sellSignal = dir == -1 and dir[1] == 1

//DEFININDO AS FUNÇÕES DE COMPRA E VENDA
strategy.entry("long", strategy.long, when = buySignal)
strategy.entry("short", strategy.short, when = sellSignal)