Dynamic Dual Exponential Moving Average Trading Strategy

Overview
This strategy is named "Dynamic Dual Exponential Moving Average Trading Strategy". It is a quantitative trading strategy based on the dual exponential moving average (DEMA). The strategy calculates the price change rate of stocks, and then performs dual exponential smoothing on both its absolute value and non-absolute value, so as to obtain the True Strength Index (TSI). The strategy generates buy and sell signals based on the golden/dead cross of the TSI value and its signal line.
Strategy Principle
The core indicator of this strategy is the True Strength Index (TSI). The calculation formula of TSI is:
TSI = 100 * (PC1 / PC2)
Where PC1 and PC2 are the dual exponential moving averages of the price change rate and the absolute value of the price change rate, respectively. The dual exponential moving average is calculated by first applying an exponential moving average with one length to the price change rate, and then applying another shorter exponential moving average to the obtained moving average. This dual smoothing can better eliminate the randomness in the price change rate and improve the stability of the TSI indicator.
After calculating the TSI value, the strategy also calculates a signal line for the TSI value. The signal line is defined as an exponential moving average of the TSI value over a certain period. In actual trading, the strategy judges market trends and generates trading signals by observing the relationship between the TSI value and its signal line. When the TSI value crosses above the signal line, it is a buy signal. When the TSI value crosses below the signal line, it is a sell signal.
Another feature of this strategy is that the trade size is dynamically adjusted. The strategy code sets an initial capital and a risk exposure ratio as input parameters. These two parameters combine with the current price of the stock to dynamically calculate the number of contracts traded or risk exposure. This can better control the overall risk of the entire strategy.
Advantage Analysis
The dynamic dual exponential moving average trading strategy comes with several advantages:
-
It utilizes the TSI indicator which applies dual exponential smoothing, making it less sensitive to market noise and able to generate more accurate signals.
-
It builds upon the proven principle of crossing of an indicator and its signal line to generate trading signals. This eliminates many false signals.
-
The strategy dynamically adjusts position sizing based on the risk budget. This helps prevent overtrading and emotions.
-
It works on daily and weekly timeframes, suitable for both swing trading and positional trading.
-
It is easy to implement in bots and other trading systems due to the simple entry/exit logic.
-
There are not too many parameters to tune, making the system easy to optimize.
These advantages combined make it a robust and versatile trading strategy for stock traders. The careful smoothing and position sizing help prevent false signals and large losses.
Risk Analysis
While the dynamic dual exponential moving average trading strategy has many advantages, it also has some inherent risks like most stock strategies:
-
Since the TSI and signal line are based on historical price data, there is always the risk of incorrect signals especially during volatile market conditions.
-
Whipsaws may occur if the market oscillates around the zero line of the TSI indicator. This can lead to losses.
-
Large gap moves may result in the strategy closing at a loss since it was not able to exit in time.
-
If the market continues in a strong trend, the TSI may prematurely reverse the trend resulting in missed profits.
-
Due to the leverage effect, larger losses than the limit set by the risk parameters are possible.
These risks can however be mitigated by aspects like position sizing, stop losses and other risk management techniques. Also, the parameters and filters can be further optimized to maximize performance across varying market conditions.
Optimization Directions
Some ideas to optimize this strategy include:
-
Testing different combinations of dual smoothing parameters to find the combination that generates the most accurate trading signals. The long and short cycle parameters can be adjusted for optimization.
-
Adding filters based on volatility, trading volume or other indicators to reduce unnecessary trading signals. This can reduce trade frequency while increasing the profitability of each trade.
-
Incorporating stop loss logic. For example, stopping out when TSI value crosses the zero line. This can reduce unnecessary losses.
-
Evaluating performance of different trading instruments like indices, commodities etc. under this strategy. Concentrate trading on instruments with best performance.
-
Selectively filtering trading instruments. For example, assess liquidity, volatility metrics of instruments and select ones with higher ranked parameters.
-
Using machine learning methods like walk-forward analysis to select optimal parameter combinations. This can reduce human bias in selection and obtain better parameters.
-
Employing multiple parameter sets based on varying market regimes, and dynamically switch between them. For example, more aggressive parameters during bull markets, and conservative parameters during bear markets.
By testing and optimizing various aspects above, there is potential to further improve this strategy's stability and profitability.
Summary
In summary, this strategy leverages the dual exponential smoothing properties of the TSI indicator to design a relatively stable and reliable stock trading strategy. By dynamically adjusting position sizes, the overall risk level can be effectively controlled. The strategy combines the advantages of being suitable for both short-term and medium-long term trading.
Of course, like most quantitative trading strategies, this strategy also has some limitations, mainly reflected in being prone to effects of drastic market fluctuations. In addition, parameter selection and filtering criteria need further testing and optimization in order to obtain stronger adaptiveness and profitability in the ever-changing financial markets.
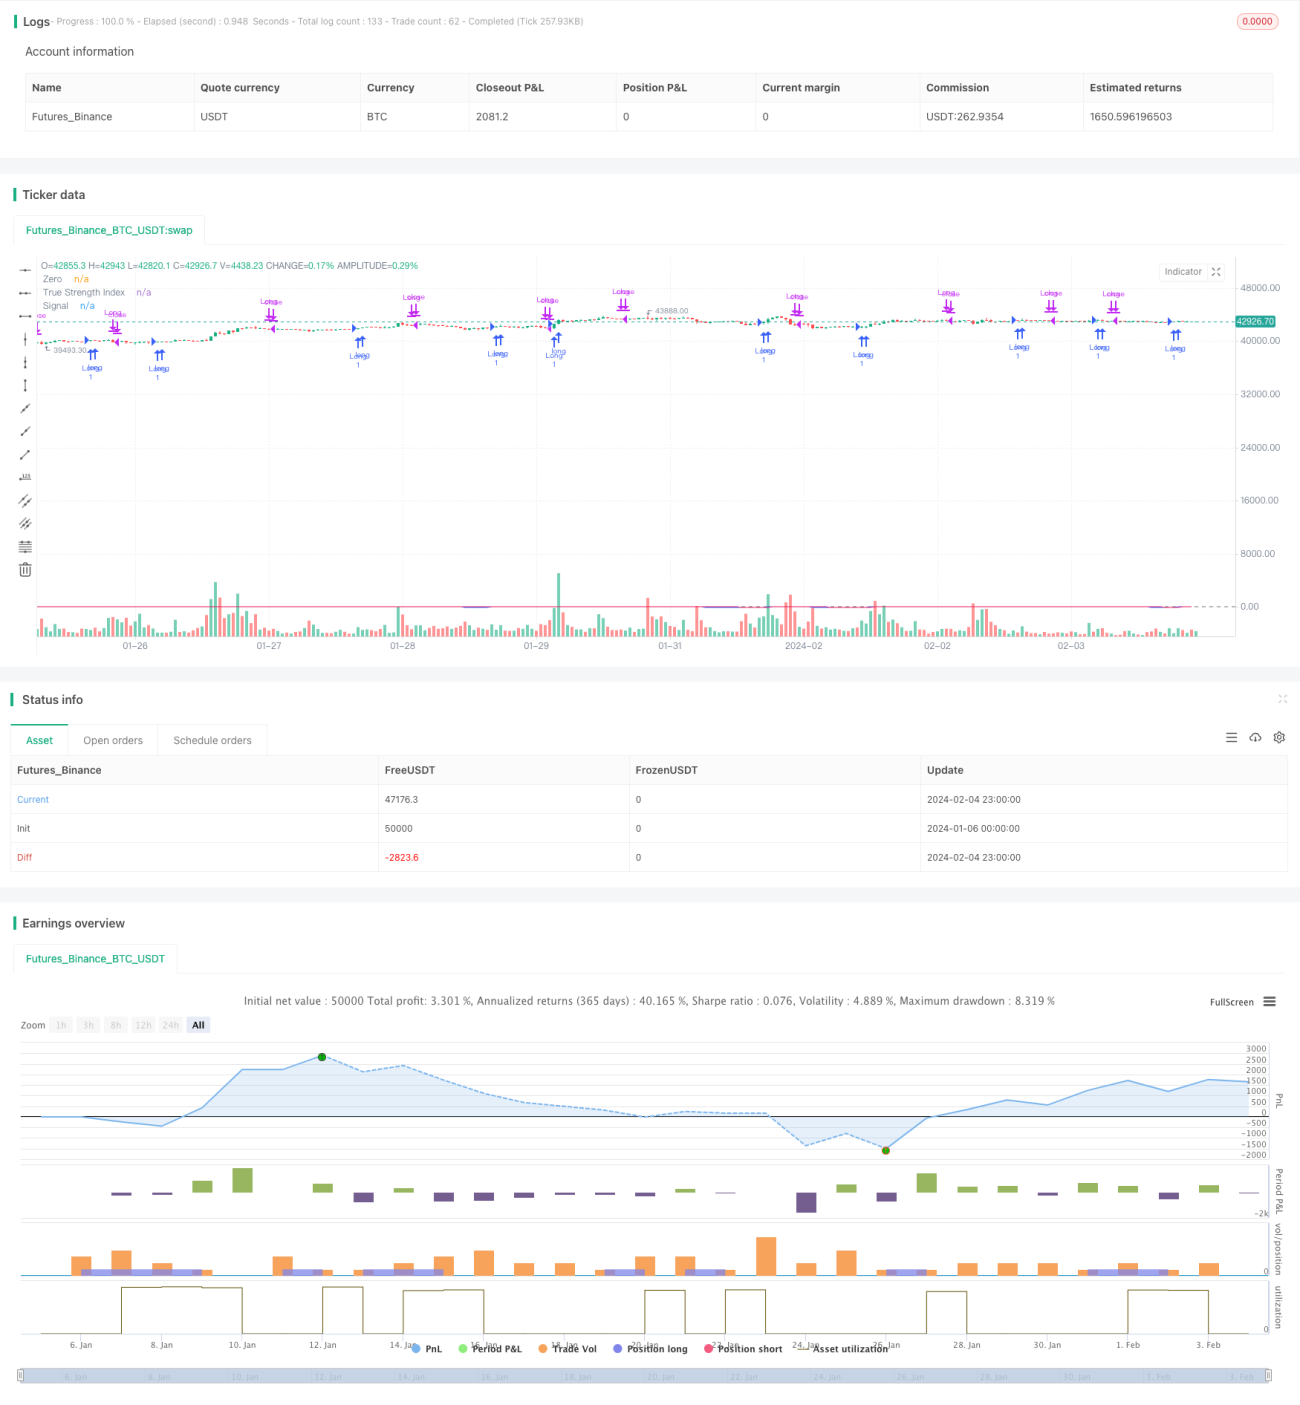
/*backtest
start: 2024-01-06 00:00:00
end: 2024-02-05 00:00:00
period: 1h
basePeriod: 15m
exchanges: [{"eid":"Futures_Binance","currency":"BTC_USDT"}]
*/

// This Pine Script™ code is subject to the terms of the Mozilla Public License 2.0 at https://mozilla.org/MPL/2.0/
// © shankardey7310

//@version=5- 1