Reversal Tracking Strategy

Author: ChaoZhang, Date: 2024-02-06 10:03:40
Tags:

img

Overview

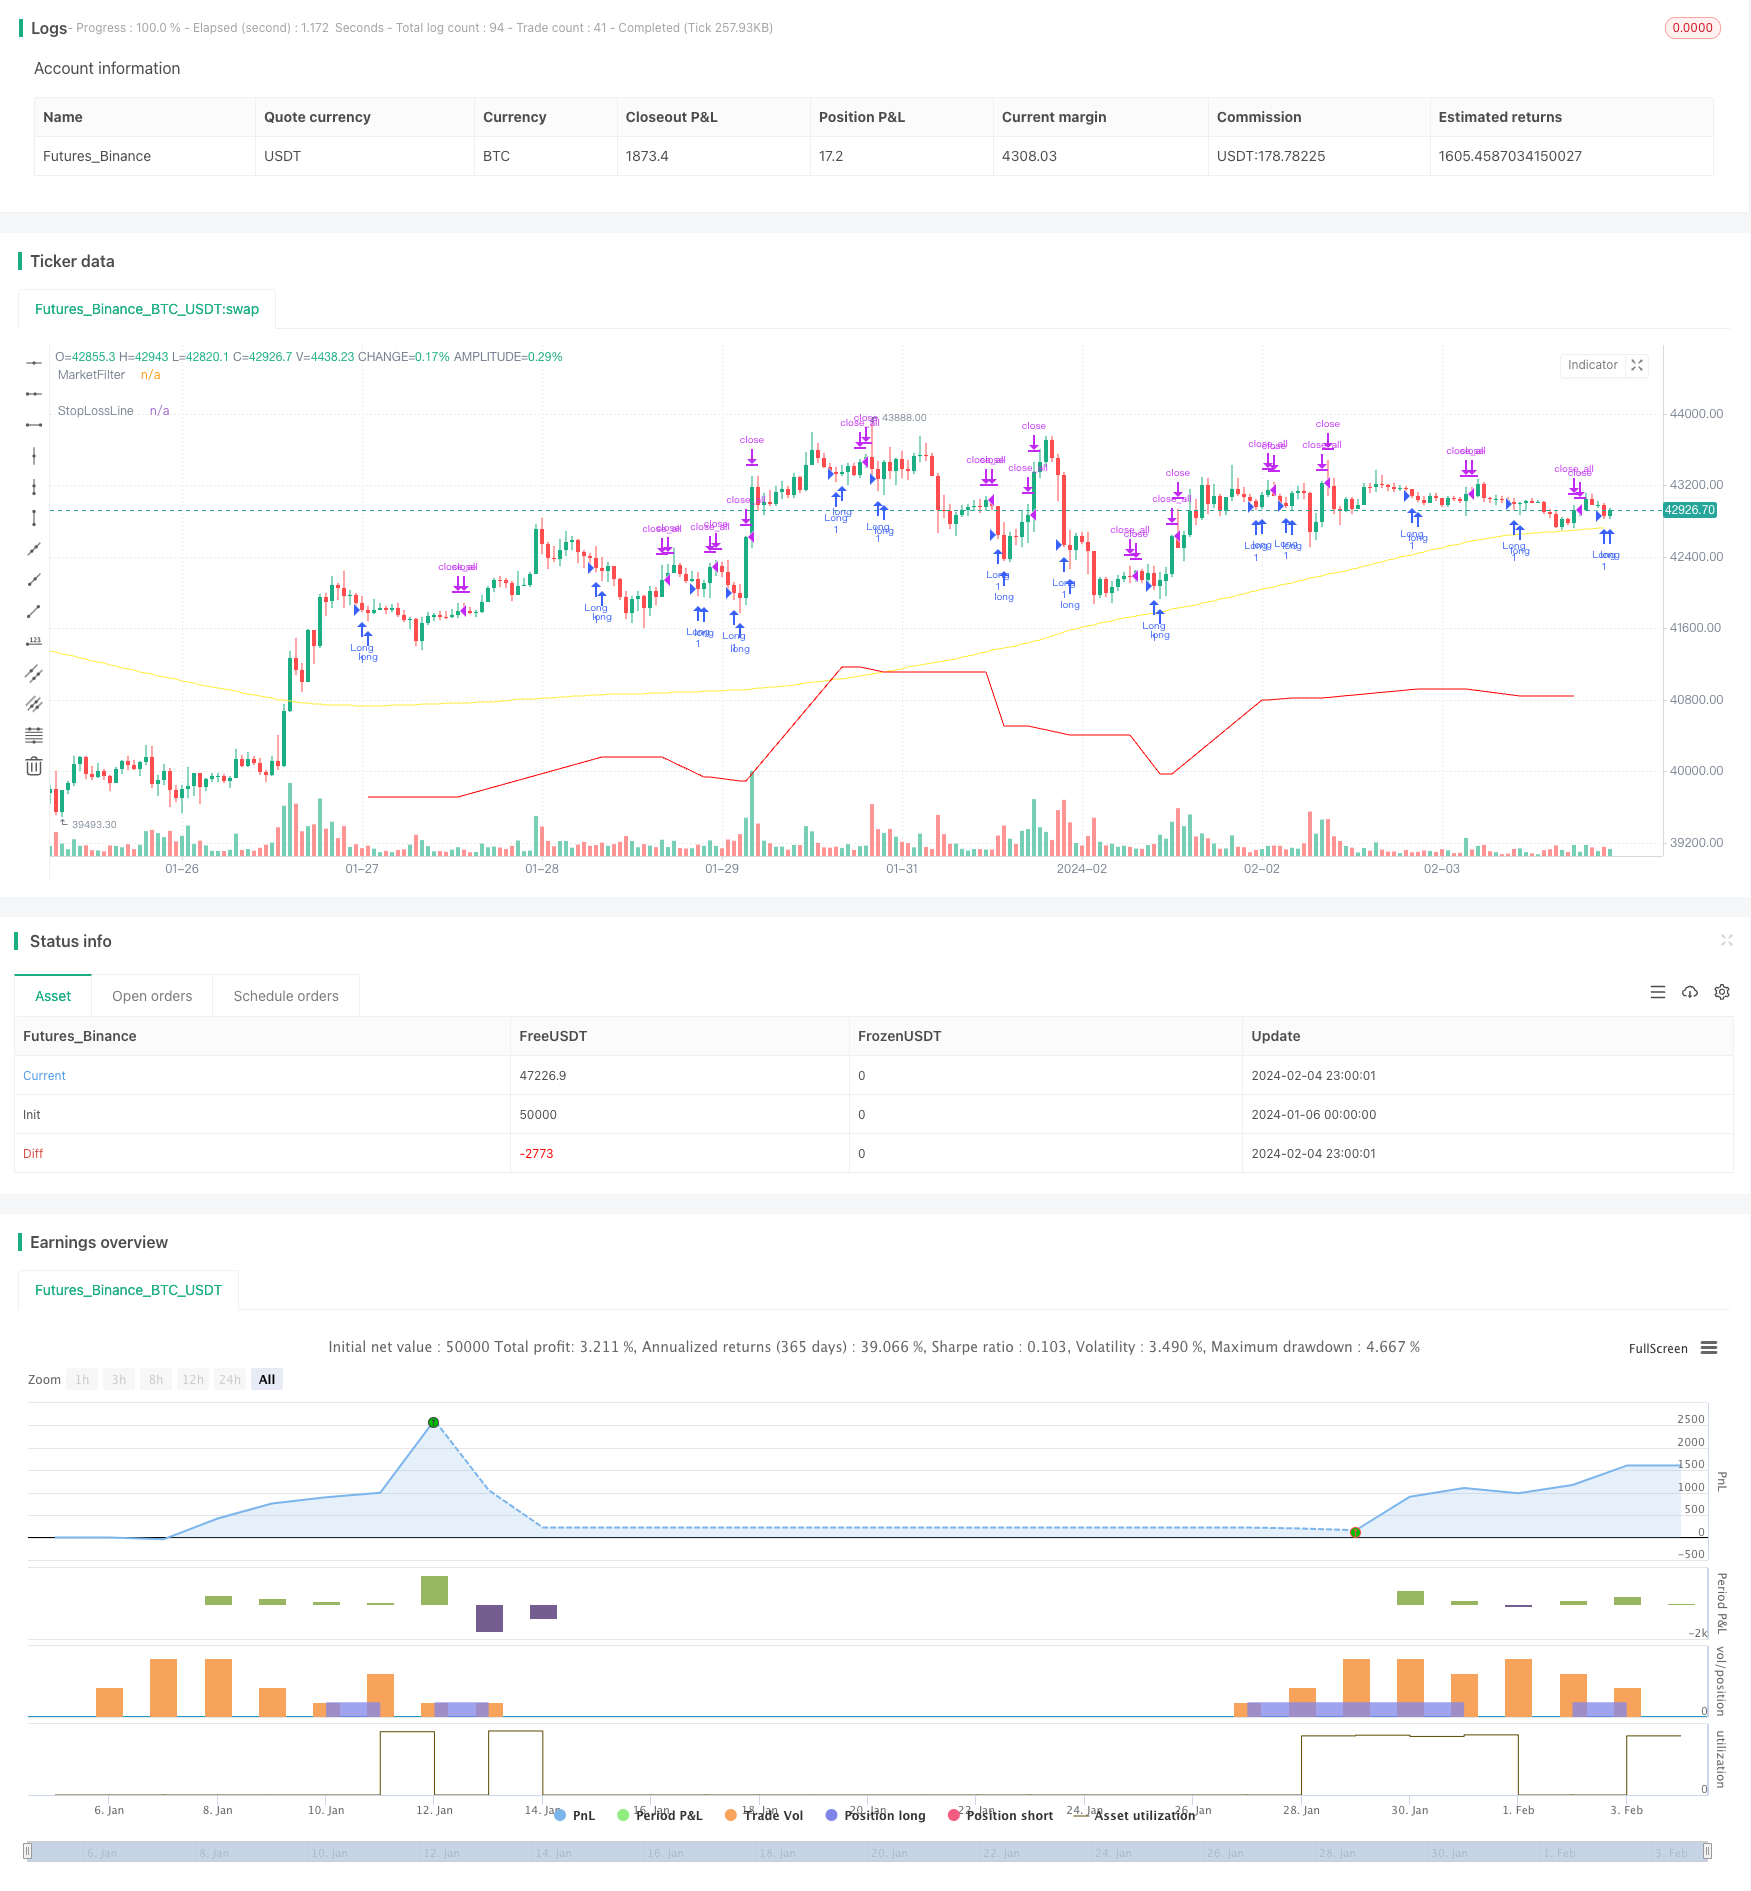
The Reversal Tracking strategy is a trend tracking strategy that combines moving averages as market filters. It establishes positions when price reversal signals occur to implement buy low and sell high, tracking the trend after price reversals to gain excess returns.

Strategy Logic

The core logic of this strategy is: establishing long positions when the close is lower than the low N days ago; closing long positions when the close is higher than the high N days ago. It also combines the 200-day simple moving average as a market filter - long positions are only established when prices are above the 200-day moving average.

This strategy is based on price reversal theory, which believes that trends in stock prices will repeatedly show highs and lows. When prices break below the low formed N days ago, it is time to establish long positions; when prices break above the high N days ago, it indicates that the reversal uptrend has ended and it is time to take profits.

Specifically, the core modules of this strategy are:

  1. Market Filter

    Use the 200-day simple moving average to judge market trends. Allow establishing positions only when stock prices are above the 200-day line. This avoids establishing short positions in a bull market or establishing long positions in a bear market.

  2. Reversal Signal Judgement

    Logic: Close < Lowest price N days ago

    If the close is lower than the lowest price N days ago (default 5 days), it indicates a downside price breakdown and triggers a buy signal.

  3. Take Profit Signal Judgement

    Logic: Close > Highest price N days ago

    If the close is higher than the highest price N days ago (default 5 days), it indicates the reversal uptrend has ended and triggers a take profit signal.

  4. 5% Stop Loss

    Set a 5% stop loss line from the entry price to avoid excessive losses.

Advantage Analysis

The main advantages of this strategy are:

  1. Adopting price reversal theory allows establishing positions at the beginning of price reversals and tracking subsequent trends.
  2. Combining moving averages as market filters avoids establishing inappropriate long or short positions, reducing the risk of being trapped in wrong positions.
  3. Using the highest and lowest prices N days ago to determine reversal signals provides flexible parameters that can be adjusted based on market conditions.
  4. The 5% stop loss can quickly cut losses and avoid excessive losses per trade.
  5. Achieve buying low and selling high by tracking excess returns from price reversal trends.

Risk Analysis

There are also some risks with this strategy:

  1. Price reversal signals could be false breakouts, unable to initiate real trend reversals, thus leading to losses.
  2. Inappropriate N day parameter settings may miss real reversal points or trigger premature stop losses.
  3. If the stop loss percentage is too high, single trade losses may be too large; if too small, stop losses may be triggered prematurely.
  4. This strategy is more suitable for indexes and some uptrend stocks, not ideal for mean reversion trading on the overall stock universe.

Optimization Directions

The strategy can be optimized in the following aspects:

  1. Optimize moving average parameters to test the effects of different day inputs.
  2. Test adjusting the N parameter for reversal signal judgment to find optimal parameter combinations.
  3. Optimize the stop loss percentage to balance between stop losses and holding time.
  4. Add momentum indicators and other filters to ensure more reliable trading signals.
  5. Set independent parameter combinations for different trading products and optimize via backtesting.

Summary

The Reversal Tracking Strategy combines moving average indicators to determine market conditions and utilizes reversal theory to select entry timing. The risk control mechanisms of take profit and stop loss target excess returns by buying low and selling high. The strategy can be improved through parameter optimization, adding auxiliary filters, etc. It can achieve good returns in trending markets.


/*backtest
start: 2024-01-06 00:00:00
end: 2024-02-05 00:00:00
period: 1h
basePeriod: 15m
exchanges: [{"eid":"Futures_Binance","currency":"BTC_USDT"}]
*/

//  @version=4
//  © HermanBrummer
//  This source code is subject to the terms of the Mozilla Public License 2.0 at https://mozilla.org/MPL/2.0/

//  BUYS    WHEN THE CLOSE IS SMALLER THAN THE LOW OF 5 DAYS AGO
//  SELLS   WHEN THE CLOSE IS HIGHER THEN THE HIGH OF 5 DAYS AGO
//  USES A 200 MOVING AVERGE AS A FILTER, AND DOESN'T TAKE TRADES IF THE MARKET IS BELOW IT'S 200 MA
//  USES A 5% STOP LOSS FROM ENTRIES

strategy("REVERSALS", overlay=true)

StopLoss    = input(.95, step=0.01)
HowManyBars = input( 5 )

///     EXITS
if  close > sma(high,HowManyBars)[1]
    strategy.close_all()


///     ENTRIES
MarketFilter    = sma(close, 200)
F1              = close < sma(low,HowManyBars)[1]
F2              = close > MarketFilter
plot(MarketFilter, "MarketFilter", color.yellow)

strategy.entry("Long", true, 1, when=F1 and F2)


///     STOP LOSS
StopLossLine    = strategy.position_avg_price * StopLoss
plot(StopLossLine, "StopLossLine", #FF0000)
strategy.exit("Exit", stop=StopLossLine)


More