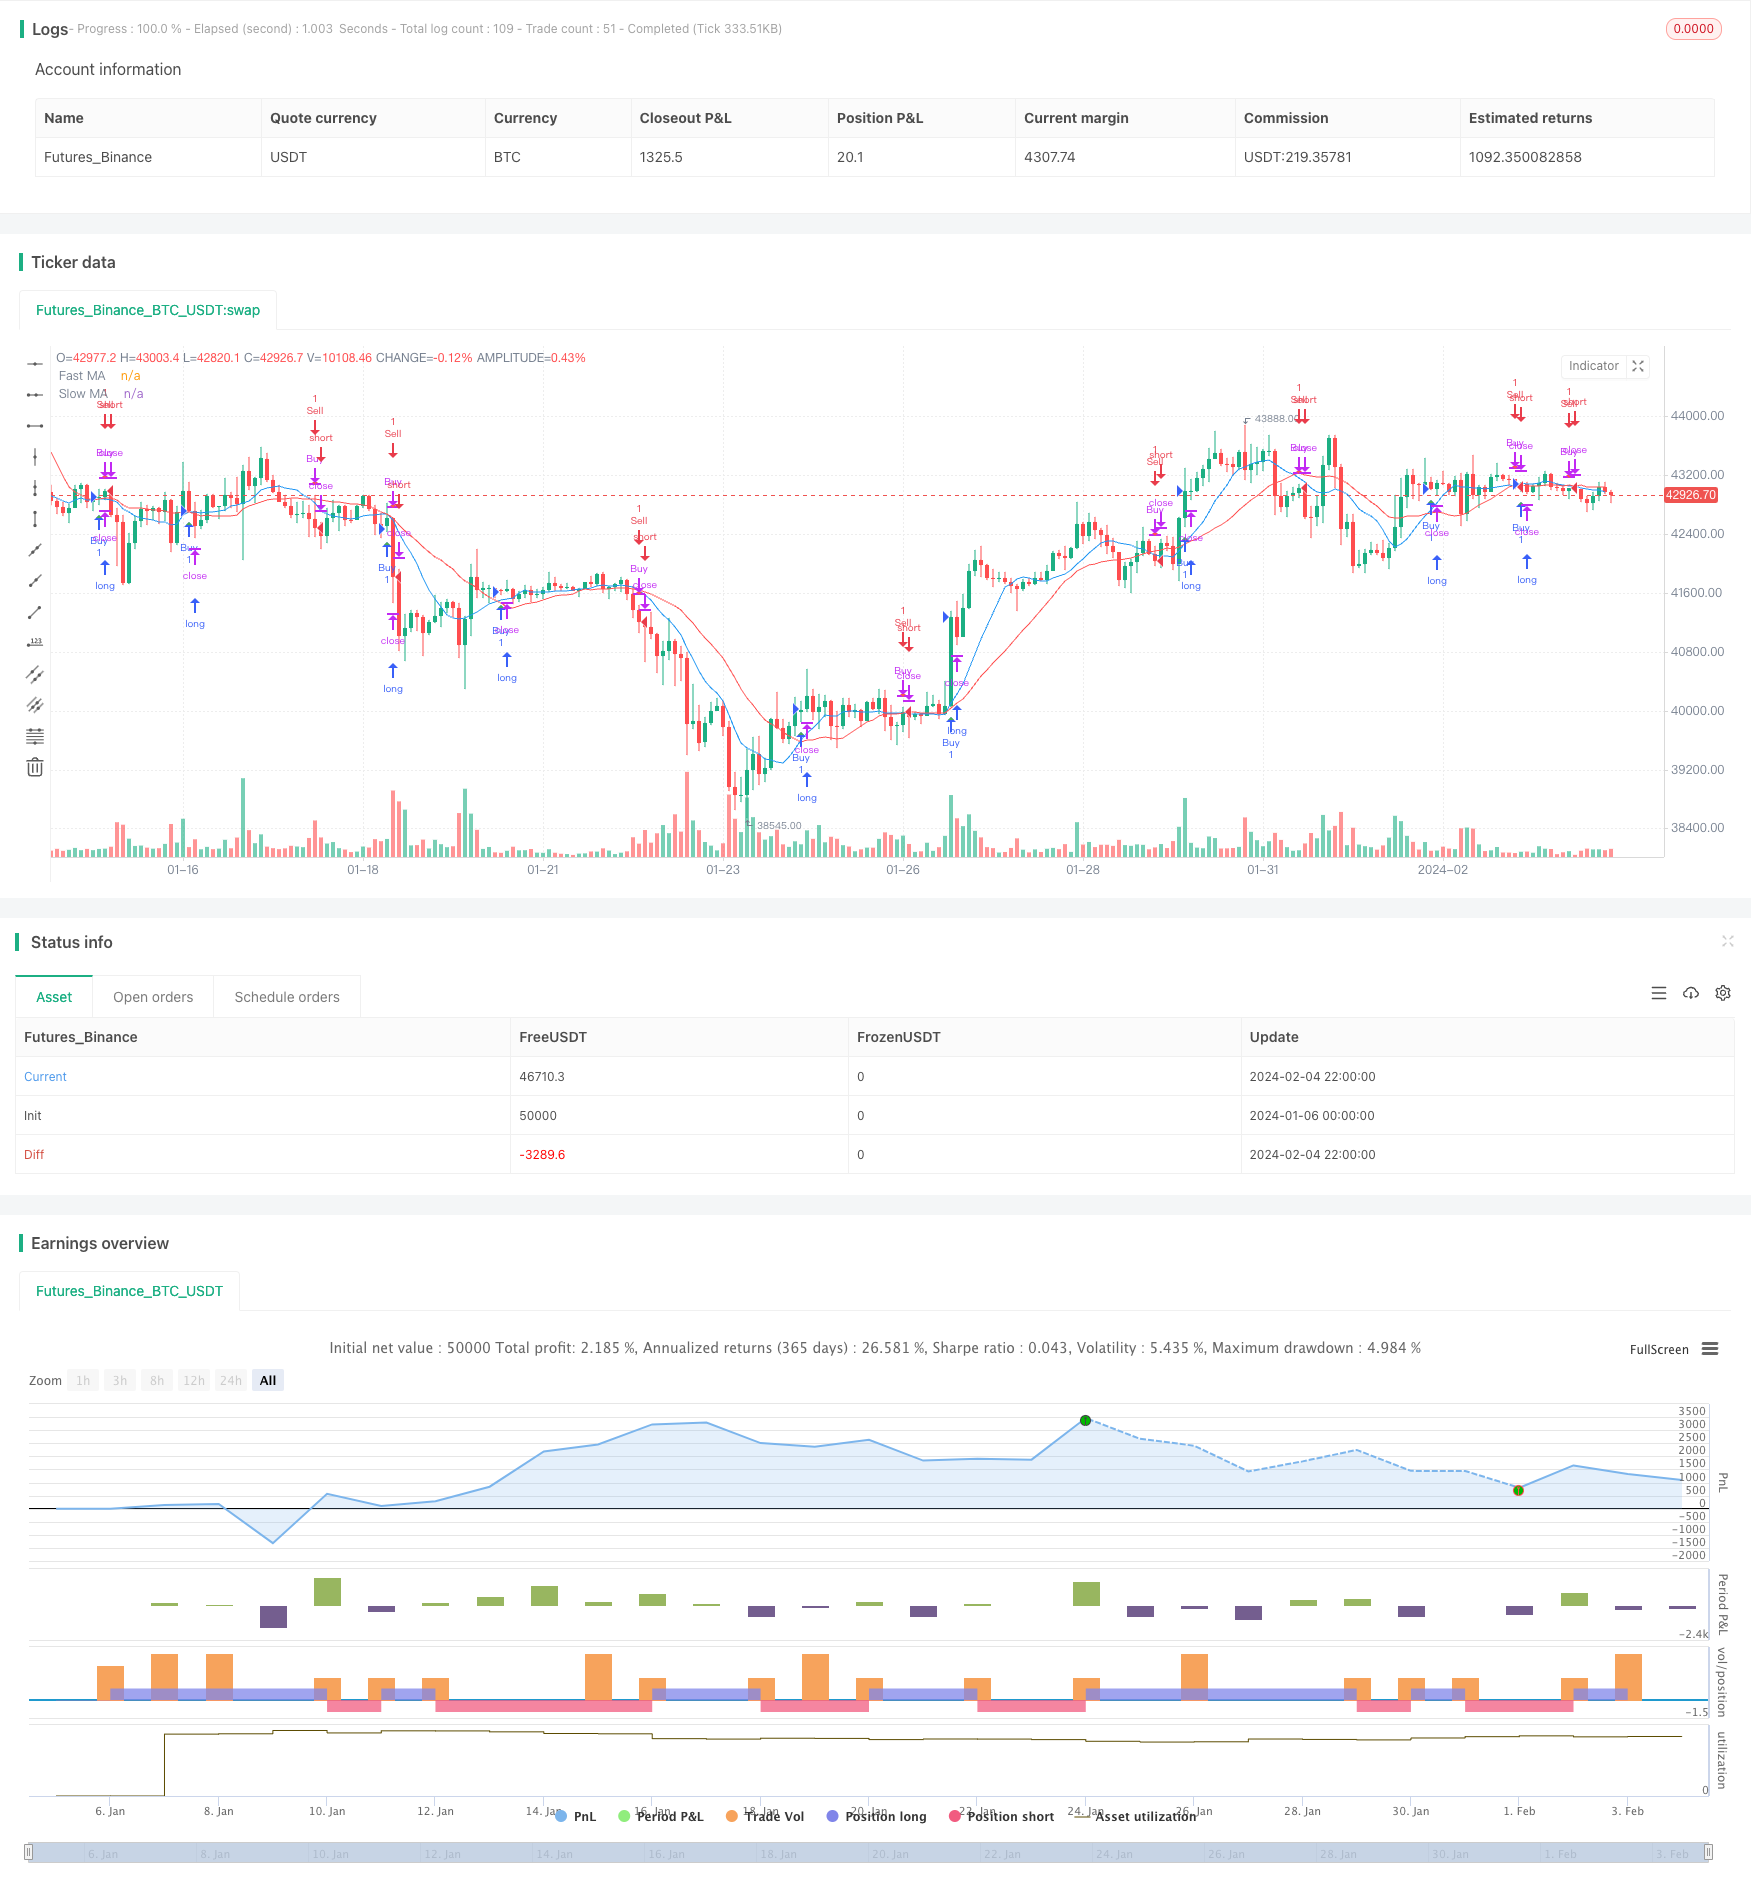
The Optimized Momentum Moving Average Crossover Strategy is a quantitative trading strategy that incorporates moving average crossover signals, position sizing, and risk management. It uses fast and slow moving average crossovers to generate trading signals and dynamically adjusts position sizes for risk control. Compared to traditional moving average crossover strategies, this strategy has undergone multi-dimensional optimizations to provide more advanced and reliable algo trading solutions.
The core trading signals of this strategy come from the crossover between two moving averages - a faster, short-term one and a slower, long-term one. Specifically, when the faster moving average crosses above the slower moving average from below, a buy signal is triggered. And when the faster moving average crosses below the slower one from above, a sell signal is generated.
As a trend-following indicator, moving averages can effectively smooth out price fluctuations and identify trend reversals. The fast moving average reacts better to short-term price changes while the slow one reflects long-term trends. The crossover between the two averages thus serves as an effective way to determine trend direction shifts.
When the fast MA crosses above the slow MA, it signals prices have reversed upward in the short run and are pushing long-term prices higher. This is a chase-up signal. And when the fast MA crosses below, it indicates short-term prices have started to decline which will also drag long-term prices down. This is a dumping signal.
Another highlight of this strategy is its risk management. It allows traders to define the risk percentage per trade and dynamically adjusts position sizes accordingly. Specifically, the position size is calculated as:
Position Size = (Account Equity × Risk Percentage) / (Risk Percentage per Trade × 100)
This way of flexibly scaling positions based on account status and acceptable risk levels enables effective risk control, a big plus of this strategy.
Compared to the plain moving average crossover system, this strategy has gone through some key optimizations:
Smarter Signal Logic. The dual fast and slow moving averages, instead of a single MA line, can identify both short-term and long-term trends, making crossover signals more reliable.
More Scientific Risk Control. Dynamically adjusting positions based on capital and acceptable risk realizes both profitability and risk management aligning with practical needs.
Better User Experience. Visual signal markers and real-time alerts enable convenient operations without staring at the screen all day.
Higher Flexibility. Customizable MA lengths and risk settings allow traders to tailor the strategy to their personal preferences and trading style.
Despite significant improvements over the basic moving average crossover system, some risks may still exist in practical applications:
Missing Price Reversals: Moving averages are trend trackers unable to catch sharp, sudden price reversals, potentially missing critical long/short entries and exits.
Sideway Markets: During prolonged sideways consolidations, MA signals tend to produce false signals so position sizes should be reduced or other strategy types considered.
Poor Parameter Choices: Inappropriate MA parameter selections lead to bad signals, requiring iterative optimization through backtesting.
Excessive Risk AppConfig: Overly aggressive risk percentage settings run the risk of overleveraging and blowups so conservative configurations aligned with personal risk tolerance are preferred.
To mitigate the above risks, some tactics can be adopted:
Adding filters like trading volumes and KD indicators to avoid missing reversals.
Switching to oscillation-type strats or reducing positions in certain market regimes.
Thoroughly backtesting to find optimal parameters or segmented settings across products.
Carefully configuring risk parameters, pyramiding positions, limiting per trade loss.
Further optimizations can be explored across the following dimensions:
Signal Filtering: Additional filters like KDJ, Bollinger Bands to enhance signal reliability.
Adaptive Parameters: Using machine learning techniques to dynamically optimize MA lengths based on changing market conditions.
Profit Take & Stop Loss: Incorporating trailing stops, fixed ratio profit-taking to lock in profits and control losses.
Strategy Composition: Composing with other strats like sticky levels, oscillators to obtain more steady and substantial alpha.
Cross-Market Arbitrage: Exploiting price relationships across different markets for risk-free arbitrage.
With continuous efforts in testing and enhancing, we are confident in developing this strategy into a reliable, controllable, alpha-generating algo trading solution.
The Optimized Momentum Moving Average Crossover Strategy delivers trading signals through fast and slow MA crossovers and manages risk via dynamic position adjustment, making it a fairly comprehensive algo trading system. Compared to traditional MA strats, this optimized version marks major upgrades in signal efficacy, risk control, user experience and more. As further improvements proceed in fine-tuning parameters, filtering signals, integrating stop runs, and strategy composition, it shows great promise in becoming an ideal profitable yet risk-defined strategy for retail traders.
/*backtest start: 2024-01-06 00:00:00 end: 2024-02-05 00:00:00 period: 2h basePeriod: 15m exchanges: [{"eid":"Futures_Binance","currency":"BTC_USDT"}] */ //@version=4 strategy("Improved Moving Average Crossover", overlay=true) // Input parameters fastLength = input(10, title="Fast MA Length") slowLength = input(20, title="Slow MA Length") riskPercentage = input(1, title="Risk Percentage", minval=0.1, maxval=5, step=0.1) // Calculate moving averages fastMA = sma(close, fastLength) slowMA = sma(close, slowLength) // Plot moving averages on the chart plot(fastMA, color=color.blue, title="Fast MA") plot(slowMA, color=color.red, title="Slow MA") // Trading signals longCondition = crossover(fastMA, slowMA) shortCondition = crossunder(fastMA, slowMA) // Position sizing based on percentage risk riskPerTrade = input(2, title="Risk Per Trade (%)", minval=1, maxval=10, step=0.5) equity = strategy.equity lotSize = (equity * riskPercentage) / (riskPerTrade * 100) strategy.entry("Buy", strategy.long, when=longCondition) strategy.close("Buy", when=shortCondition) strategy.entry("Sell", strategy.short, when=shortCondition) strategy.close("Sell", when=longCondition) // Plot trades on the chart using plotshape plotshape(series=longCondition, color=color.green, style=shape.triangleup, location=location.belowbar, size=size.small, title="Buy Signal") plotshape(series=shortCondition, color=color.red, style=shape.triangledown, location=location.abovebar, size=size.small, title="Sell Signal") // Alerts alertcondition(longCondition, title="Buy Signal", message="Buy Signal!") alertcondition(shortCondition, title="Sell Signal", message="Sell Signal!")template: strategy.tpl:40:21: executing "strategy.tpl" at <.api.GetStrategyListByName>: wrong number of args for GetStrategyListByName: want 7 got 6