Advanced RSI Indicator Trading Strategy

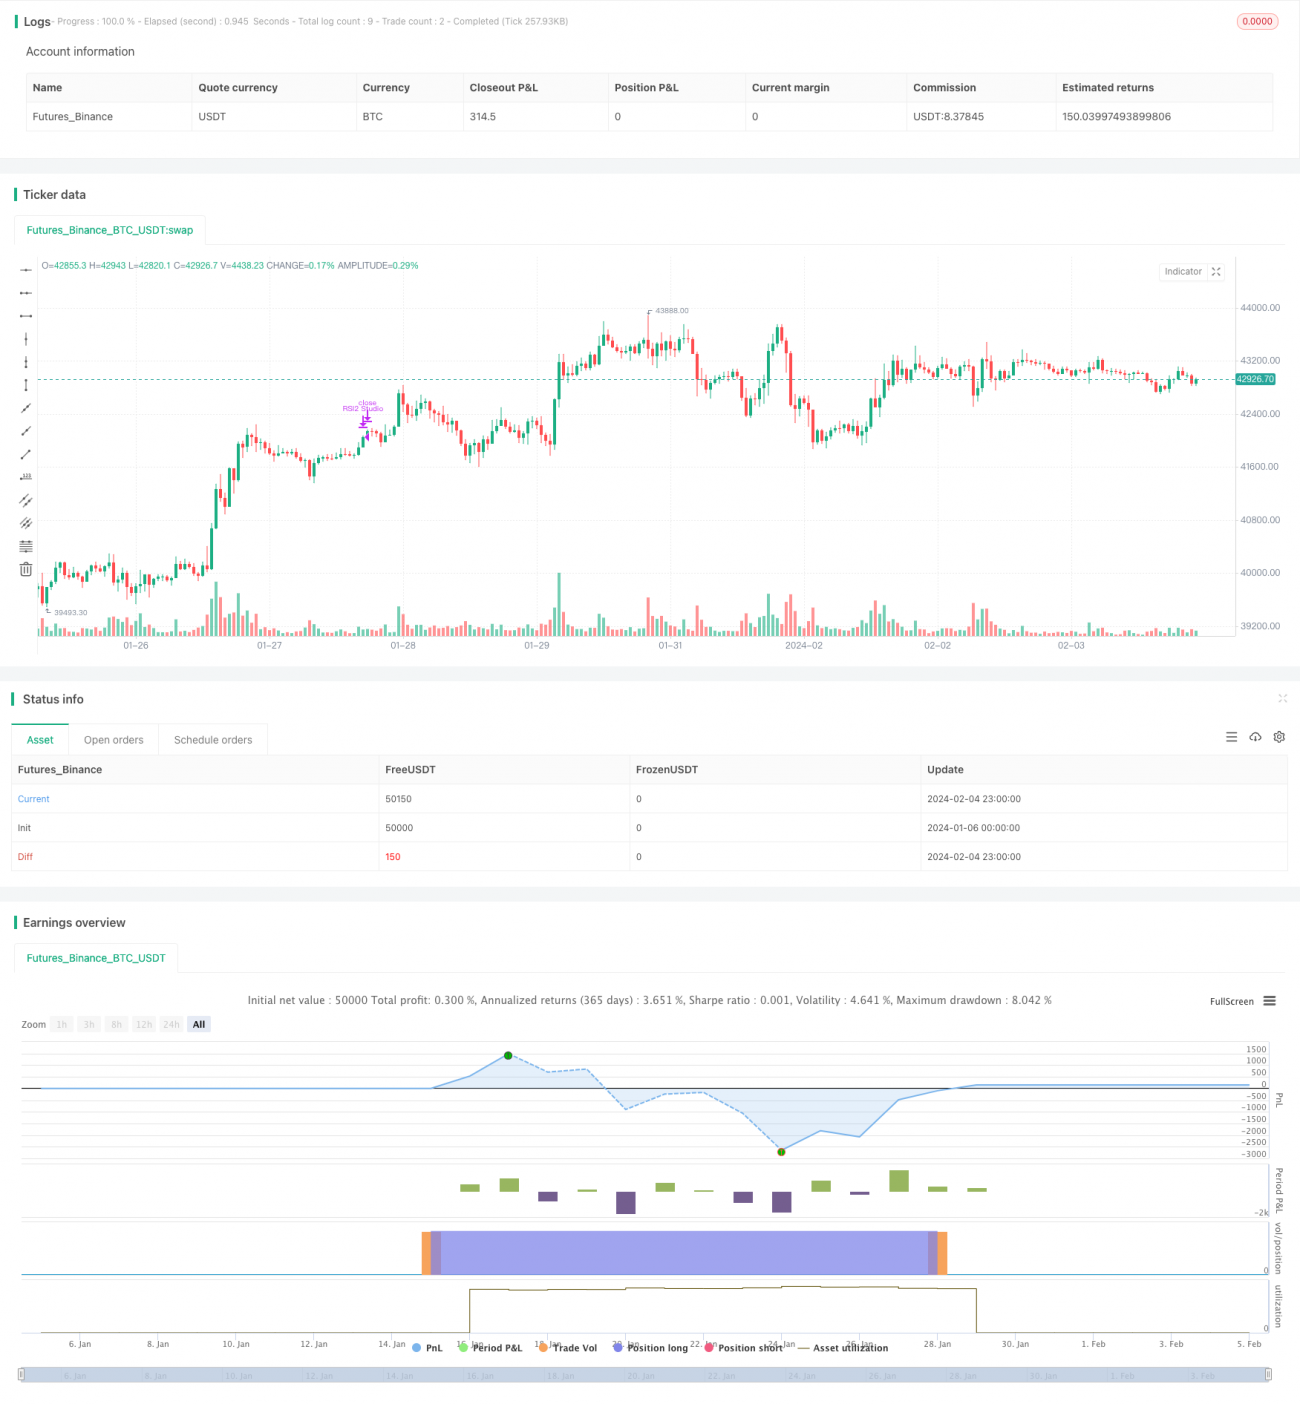
Overview
The S&P500 Advanced RSI Indicator Trading Strategy is a medium to long term trend following strategy for trading the S&P500 index. This strategy combines multiple filters with RSI overbought and oversold signals to control risk and reduce false signals.
Strategy Logic
The core indicator of this strategy is RSI, using 2 period RSI to determine price overbought and oversold levels. It goes long when RSI drops below the oversold line and closes position when RSI rises above the overbought line. In addition, the strategy has a series of auxiliary filters to control risk:
-
Weekly RSI Filter: Requires weekly RSI to be below a threshold to avoid overly aggressive longs in a bull market.
-
MA Filter: Requires price to be above a certain MA period to ensure entering after an uptrend has started.
-
Secondary RSI Filter: Requires the secondary RSI indicator also drops below oversold line to avoid false breakouts.
-
ATR Breakout Filter: Avoids going long after a sharp price drop to control risk.
The combination of these multiple filters can effectively identify medium to long term price reversal points, control trade frequency and reduce risk.
Advantage Analysis
The S&P500 Advanced RSI Indicator Trading Strategy has the following advantages:
-
Combining multiple auxiliary indicators reduces false signals and improves reliability.
-
The ATR breakout filter controls risk by avoiding buying after a price crash.
-
Weekly RSI filter prevents overly aggressive longs in a bull market.
-
MA filter ensures entering after an uptrend has started.
-
Secondary RSI filter avoids false RSI breakouts.
-
Suitable for medium to long term holding and avoids overtrading.
Risk Analysis
The main risks of this strategy come from the following aspects:
-
RSI as the main indicator has some lagging.
-
Filter conditions could be too strict and miss opportunities.
-
Stop loss could be taken out during flash crashes.
-
Simple RSI and filters have limited capabilities in complex market conditions.
Corresponding mitigations:
-
Adjust parameters to avoid missing trades.
-
Increase position sizing to account for some missed trades.
-
Relax filter conditions moderately to increase trade frequency.
-
Consider combining more indicators for complex market analysis.
Optimization Directions
The strategy can be further optimized in the following directions:
-
Test adjusting RSI parameters to find optimal overbought/oversold lines.
-
Test MA period parameters to determine optimal values.
-
Test adjusting ATR parameters to optimize price breakout filters.
-
Try combining other indicators for better analysis of complex markets.
-
Optimize weekly RSI parameters to find optimal settings.
-
Optimize secondary RSI parameters including period and overbought/oversold lines.
Conclusion
The S&P500 Advanced RSI Indicator Trading Strategy identifies medium to long term trend reversal points using RSI and multiple filter conditions to control risk. It utilizes the strengths of RSI effectively to lock in medium/long term trends and avoid overtrading. As parameters continue to be optimized, strategy performance can continue improving. Overall it is suitable for medium to long term value investing and is a relatively stable quantitative strategy.
/*backtest
start: 2024-01-06 00:00:00
end: 2024-02-05 00:00:00
period: 1h
basePeriod: 15m
exchanges: [{"eid":"Futures_Binance","currency":"BTC_USDT"}]
*/

//@version=5
// Lets connect on LinkedIn (https://www.linkedin.com/in/lets-grow-with-quality/)
// Optimized for S&P500 Daily. Use it as a buy confirmation on certain levels (Springs, Pullbacks, ...) or let it run
// without "Weekly RSI Filter" and pyramiding for 4 x more trades.- 1