Quantitative Trading Strategy for Bottom Reversal

Author: ChaoZhang, Date: 2024-02-06 15:16:39
Tags:

img

Overview

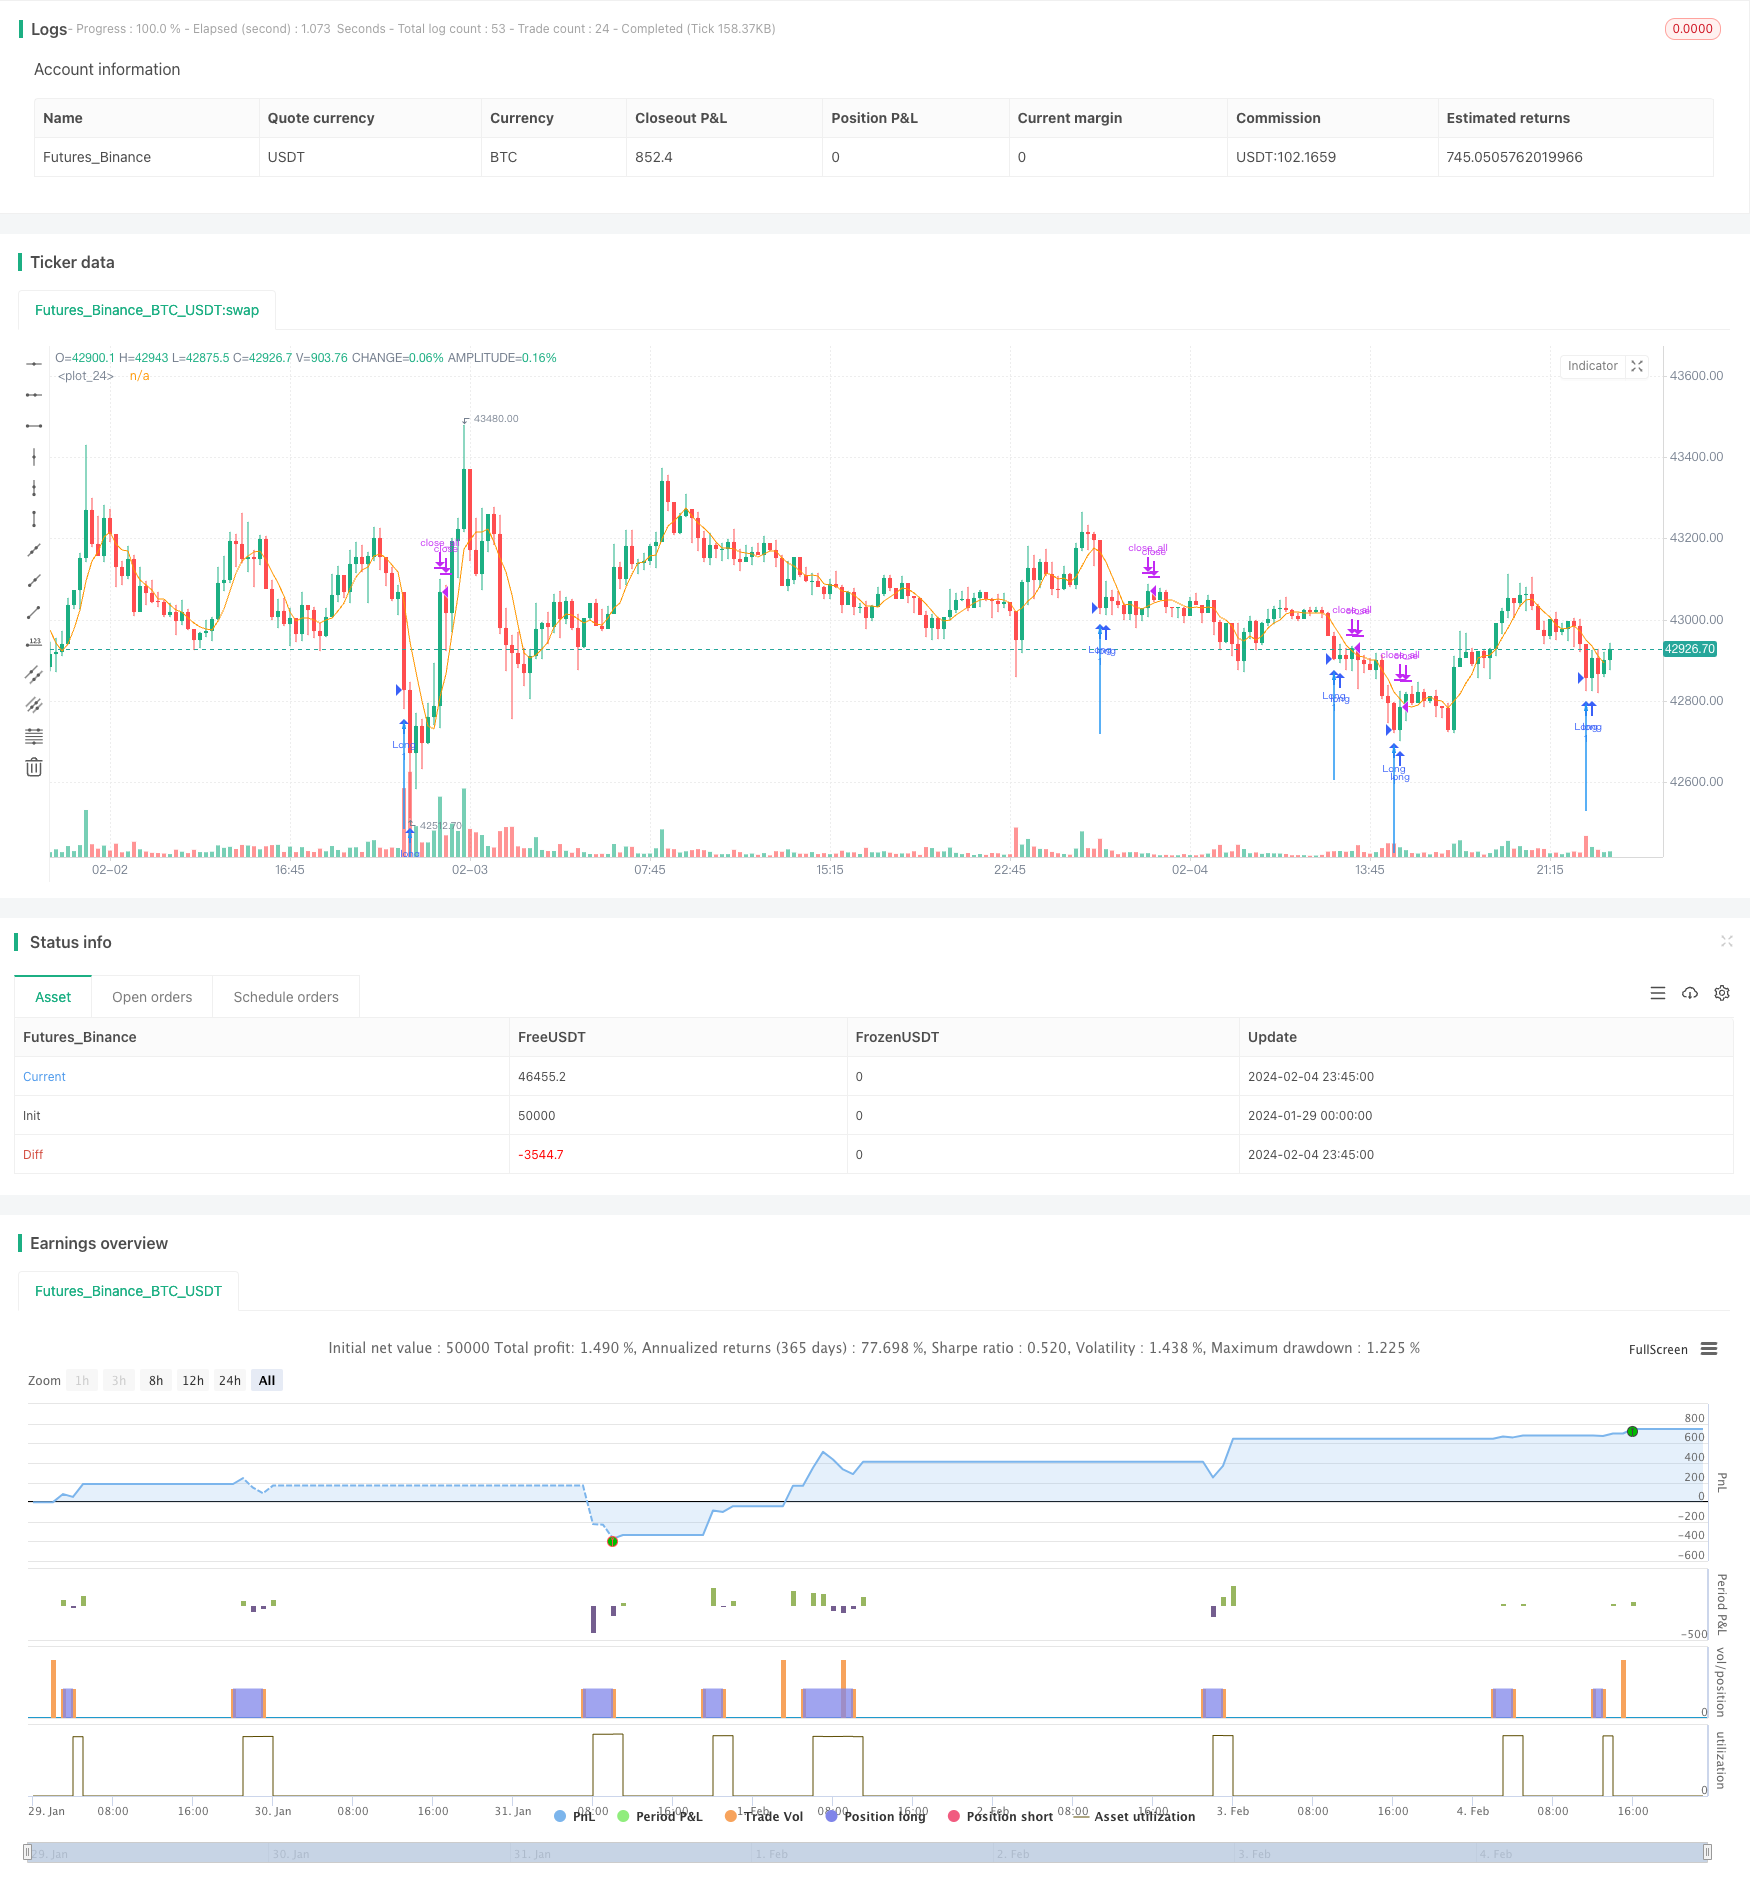
This strategy identifies market bottom by calculating fast RSI indicator and K-line entity filter to determine oversold status. When fast RSI drops below 10 and K-line entity expands, it considers reversal signal appears for entering long position. This allows detecting market bottom effectively.

Strategy Logic

The strategy is mainly based on two indicators:

  1. Fast RSI Indicator. By calculating the rise and fall percentage of recent 2 days, it quickly judges the overbought and oversold of the market. When fast RSI is below 10, the market is considered oversold.

  2. K-line Entity Filter. By calculating the ratio between K-line entity volume and MA, when the entity volume is greater than 1.5 times MA volume, it is considered as bottom signal.

Firstly, fast RSI below 10 indicates oversold market. Secondly, K-line entity expands to satisfy the condition that entity volume is greater than 1.5 times MA volume. When both conditions are met, it sends out long signal and considers market reaches bottom reversal, which filters out many false signals.

Advantage Analysis

The strategy has the following advantages:

  1. The fast RSI indicator is sensitive and can quickly determine overbought and oversold.
  2. The K-line entity filter increases certainty and avoids false breakout.
  3. Combining fast indicator and K-line pattern can effectively determine market reversal point.
  4. Low-cost long position realizes bottom fishing operation.
  5. The strategy logic is simple and clear, easy to understand and implement.

Risk Analysis

There are also some risks in this strategy:

  1. The market may have consolidation period and keeps falling even oversold.
  2. Fast RSI may have false signals and entity filter may also be penetrated.
  3. Backtesting has overfitting risk and live trading performance may differ.

Some solutions for the risks:

  1. Combine trend indicator to avoid persistent decline.
  2. Increase other filter conditions to ensure bottom confirmation.
  3. Optimize multiple parameter combinations to improve stability.

Optimization Directions

Some directions for enhancing the strategy:

  1. Add stop loss to control downside risk.
  2. Utilize volatility indicator to avoid abnormal volatility risk.
  3. Construct multifactor model to ensure effective trading signals.
  4. Employ machine learning algorithms for parameter optimization.
  5. Judge trend on larger timeframe to avoid counter trend trading.

Conclusion

This strategy effectively identifies market bottom by fast RSI for oversold and K-line entity filter. The logic is simple for easy implementing and good for catching reversal chance. But certain risks exist and further optimization is needed to improve stability and live performance. Overall speaking, bottom reversal trading strategies designed based on this logic deserve further research.


/*backtest
start: 2024-01-29 00:00:00
end: 2024-02-05 00:00:00
period: 15m
basePeriod: 5m
exchanges: [{"eid":"Futures_Binance","currency":"BTC_USDT"}]
*/

//@version=3
strategy("MarketBottom", shorttitle = "MarketBottom", overlay = true)

//Fast RSI
src = close
fastup = rma(max(change(src), 0), 2)
fastdown = rma(-min(change(src), 0), 2)
fastrsi = fastdown == 0 ? 100 : fastup == 0 ? 0 : 100 - (100 / (1 + fastup / fastdown))

//Body Filter
body = abs(close - open)
abody = sma(body, 10)

mac = sma(close, 10)
len = abs(close - mac)
sma = sma(len, 100)
max = max(open, close)
min = min(open, close)
up = close < open and len > sma * 2 and min < min[1] and fastrsi < 10 and body > abody * 1.5
plotarrow(up == 1 ? 1 : na, colorup = blue, colordown = blue)

sell = sma(close, 5)
exit = high > sell and close > open and body > abody
plot(sell)

if up
    strategy.entry("Long", strategy.long)

if exit
    strategy.close_all()

More