概述
该策略通过计算双向运动量指数DI+、DI-以及平均方向指数ADX,结合指数移动平均线EMA产生交易信号。当DI+上穿DI-且ADX高于20时产生买入信号;当DI-下穿DI+且ADX高于25时产生卖出信号。交易止损信号为DI-上穿DI+且ADX高于30。
策略原理
计算DI+、DI-、ADX
- 调用ta.dmi()函数计算DI+、DI-、ADX
- DI+/DI-反映价格的方向性
- ADX反映价格变动的平均幅度
计算指数移动平均线EMA
- 调用自定义my_ema()函数计算EMA
- EMA能有效平滑价格数据
交易信号生成
- 买入信号:DI+上穿DI-且ADX>20且收盘价>EMA
- 说明价格趋势向上且变动幅度较大
- 卖出信号:DI-下穿DI+且ADX>25且收盘价
- 说明价格趋势向下且变动幅度较大
- 买入信号:DI+上穿DI-且ADX>20且收盘价>EMA
交易止损
- 买入止损:DI-上穿DI+且ADX>30
- 说明价格趋势反转
- 卖出止损:DI+下穿DI-且ADX>30
- 说明价格趋势反转
- 买入止损:DI-上穿DI+且ADX>30
综上,该策略综合运动量指标与趋势指标,在价格趋势性较强时产生交易信号。同时设置止损条件限制损失。
优势分析
- 使用双DI避免虚假信号
- 单一DI容易产生错误信号,结合DI+和DI-可确保趋势性
- ADX条件确保价格变动幅度较大
- 只在价格波动加剧时交易,避免震荡市
- EMA条件配合DI
- EMA可有效识别价格中长线趋势
- 严格止损条件
- 及时止损,避免巨额损失
风险分析
- 频繁止损
- 若行情出现剧烈震荡,止损会过于频繁
- 参数依赖
- DI和ADX参数需要优化找到最佳组合
- 交易频率低
- 较严格的交易条件会降低交易频率
可通过扩大止损幅度,调整参数组合,或加入附加过滤条件提高交易频率来优化。
优化方向
- 参数优化
- 优化DI和ADX参数,找到最佳参数组合
- 增加过滤器
- 如加入成交量,背离等条件过滤信号
- 扩大止损幅度
- 适当放宽止损条件,减少频繁止损
总结
该策略整合运动量指标与趋势分析指标,在价格趋势性较强时产生交易信号。设置严格的止损条件控制风险。可通过参数优化,增加信号过滤器以及适当扩大止损幅度来进一步提高策略效果。
策略源码
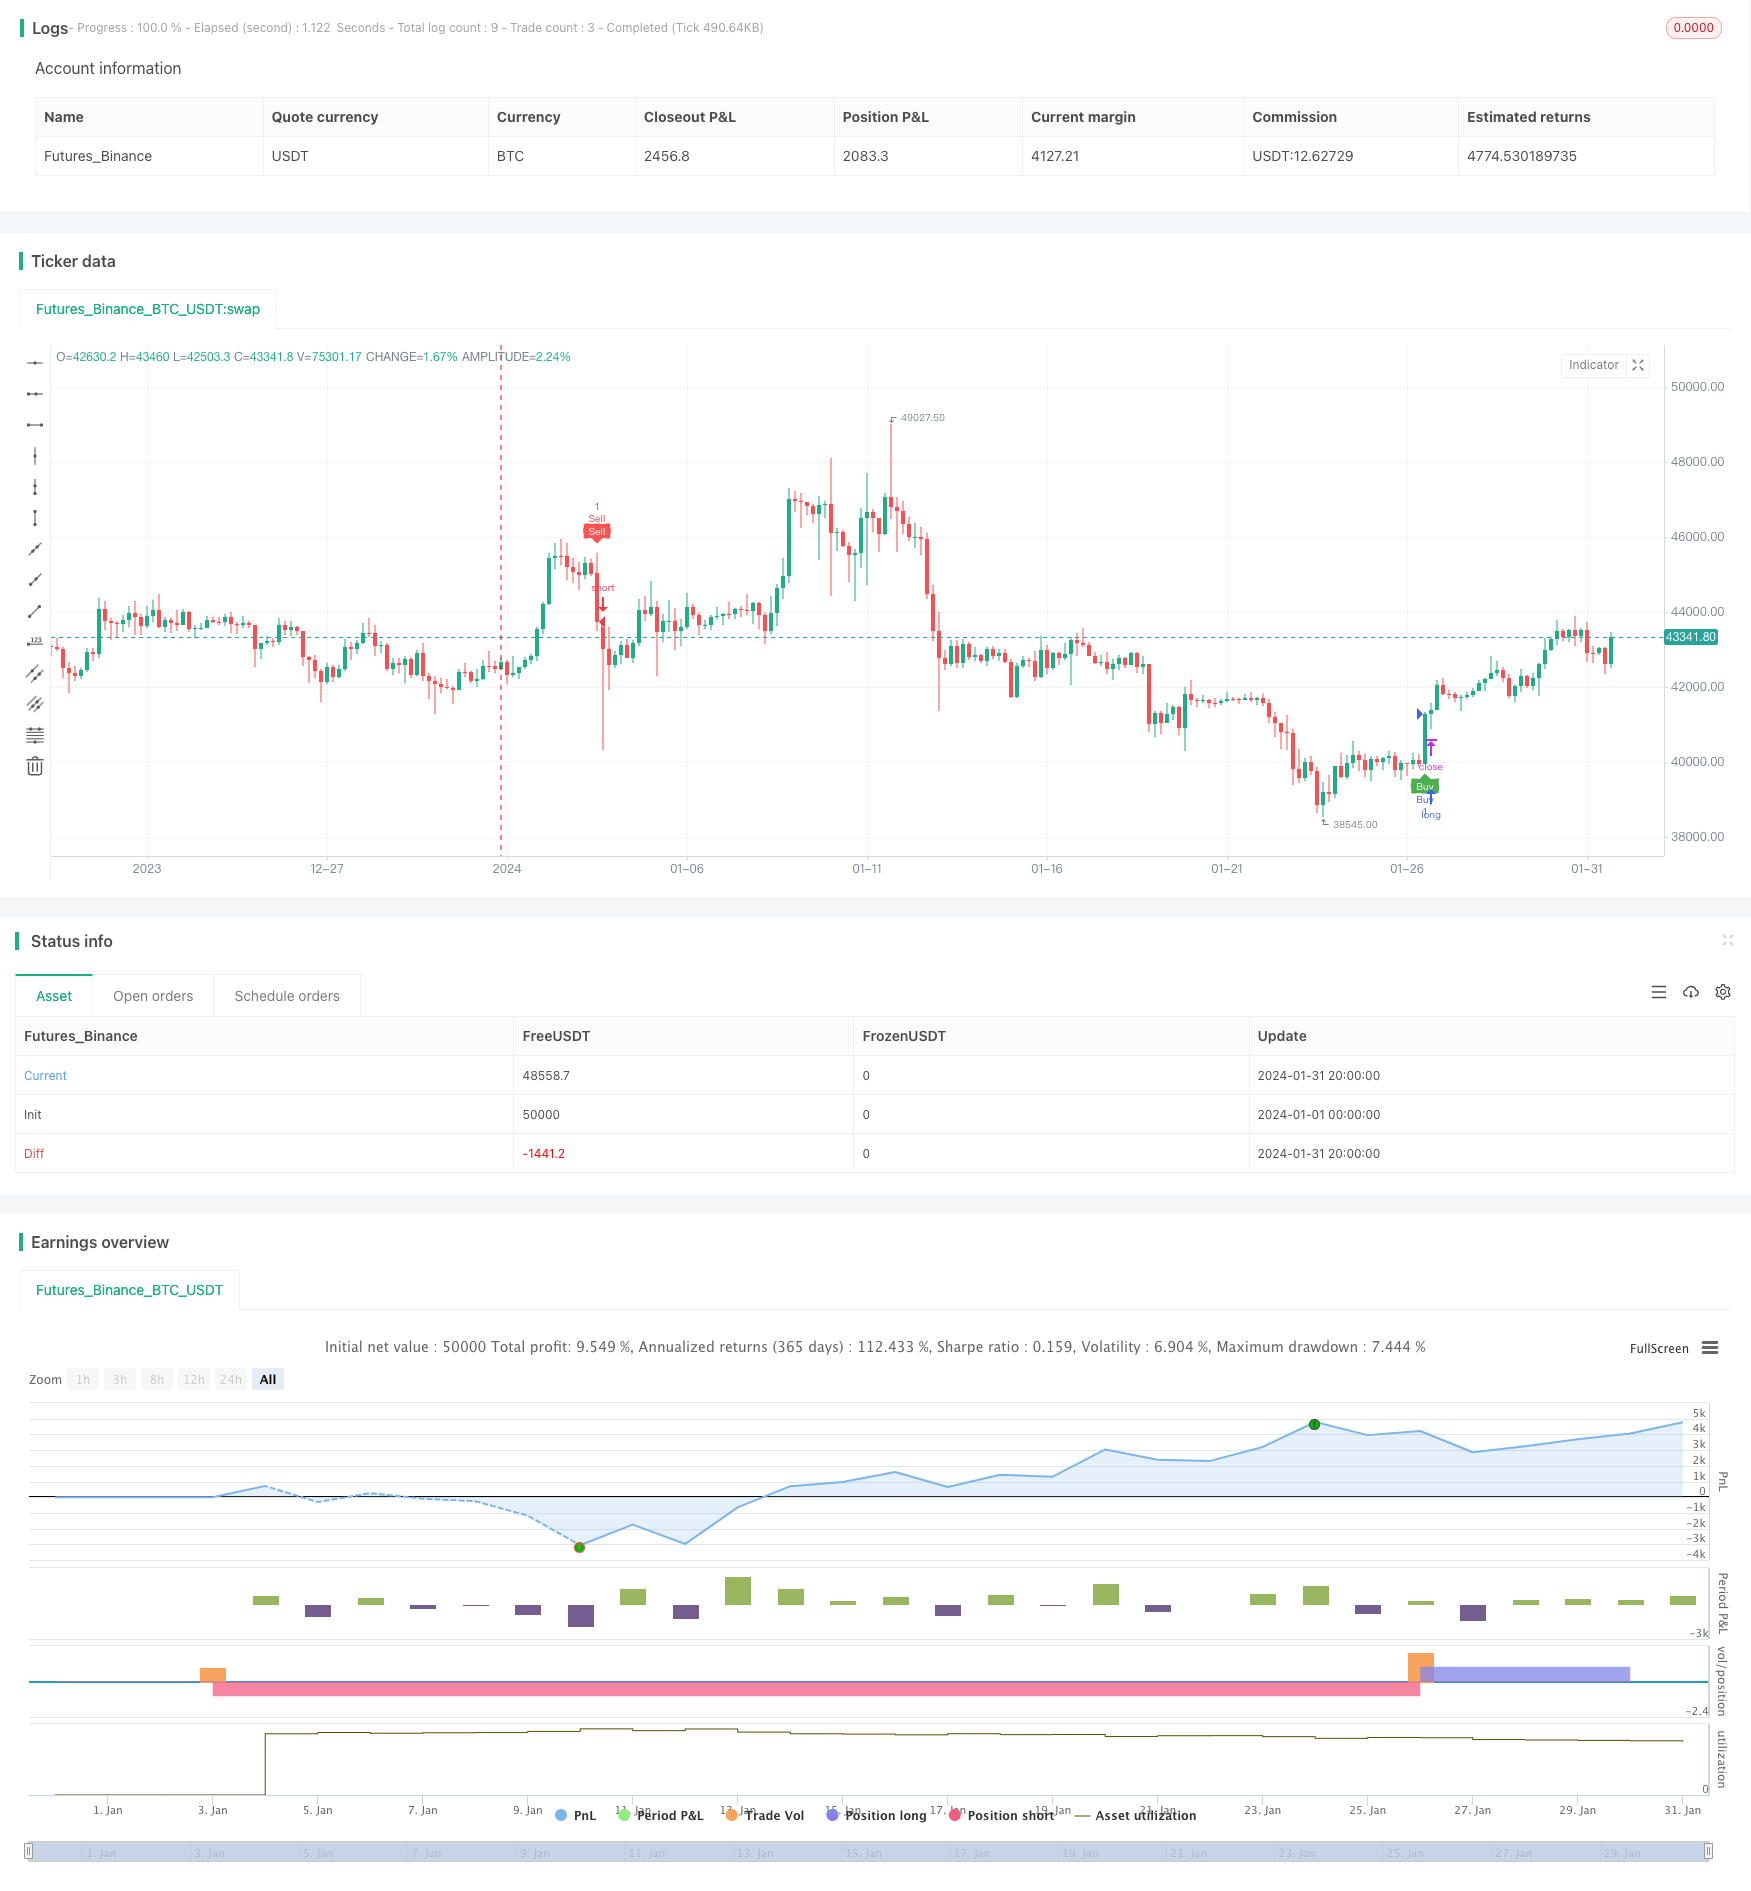
/*backtest
start: 2024-01-01 00:00:00
end: 2024-01-31 23:59:59
period: 4h
basePeriod: 15m
exchanges: [{"eid":"Futures_Binance","currency":"BTC_USDT"}]
*/

// This Pine Script™ code is subject to the terms of the Mozilla Public License 2.0 at https://mozilla.org/MPL/2.0/
// © Tamil_FNO_Trader

//@version=5
strategy("Overlay Signals by TFOT", overlay=true)

// Calculate DMI
len = input.int(14, minval=1, title="DI Length")
lensig = input.int(14, title="ADX Smoothing", minval=1, maxval=50)
[diplus, diminus, adx] = ta.dmi(len, lensig)

// Get EMA
emalen = input.int(26, minval=1, title = "EMA Length")
emasrc = input.source(close, title = "EMA Source")

my_ema(src, length) =>
    alpha = 2 / (length + 1)
    sum = 0.0
    sum := na(sum[1]) ? src : alpha * src + (1 - alpha) * nz(sum[1])
EMA2 = my_ema(emasrc, emalen)

// Variables
var bool buycondition1 = false
var bool sellcondition1 = false

var int firstbuybar = na
var int firstsellbar = na

var int buyexitbar = na
var int sellexitbar = na

var bool buyexit1 = false
var bool sellexit1 = false

// Buy & Sell Conditions
buycondition1 := (ta.crossover(diplus, diminus)) and (adx > 20) and (close > EMA2) and na(firstbuybar)
sellcondition1 := (ta.crossover(diminus, diplus)) and (adx > 25) and (close < EMA2) and na(firstsellbar)

buyexit1 := ta.crossover(diminus, diplus) and (adx > 30) and na(buyexitbar)
sellexit1 := ta.crossover(diplus, diminus) and (adx > 30) and na(sellexitbar)

if buycondition1
    if(na(firstbuybar))
        firstbuybar := bar_index
        buyexitbar := na
        firstsellbar := na
        strategy.entry("Buy", strategy.long)

if sellcondition1
    if(na(firstsellbar))
        firstsellbar := bar_index
        sellexitbar := na
        firstbuybar := na
        strategy.entry("Sell", strategy.short)

if buyexit1 and not na(firstbuybar)
    if(na(buyexitbar))
        buyexitbar := bar_index
        firstbuybar := na
        firstsellbar := na
        strategy.close("Buy")

if sellexit1 and not na(firstsellbar)
    if(na(sellexitbar))
        sellexitbar := bar_index
        firstsellbar := na
        firstbuybar := na
        strategy.close("Sell")

// Plot signals on chart
hl = input.bool(defval = true, title = "Signal Labels")

plotshape(hl and buycondition1 and bar_index == firstbuybar ? true : na, "Buy", style = shape.labelup, location = location.belowbar, color = color.green, text = "Buy", textcolor = color.white, size = size.tiny)
plotshape(hl and sellcondition1 and bar_index == firstsellbar ? true : na, "Sell", style = shape.labeldown, location = location.abovebar, color = color.red, text = "Sell", textcolor = color.white, size = size.tiny)

plotshape(hl and buyexit1 and bar_index == buyexitbar ? true : na, "Buy Exit", style = shape.labelup, location = location.belowbar, color = color.red, text = "Buy X", textcolor = color.white, size = size.tiny)
plotshape(hl and sellexit1 and bar_index == sellexitbar ? true : na, "Sell Exit", style = shape.labeldown, location = location.abovebar, color = color.red, text = "Sell X", textcolor = color.white, size = size.tiny)