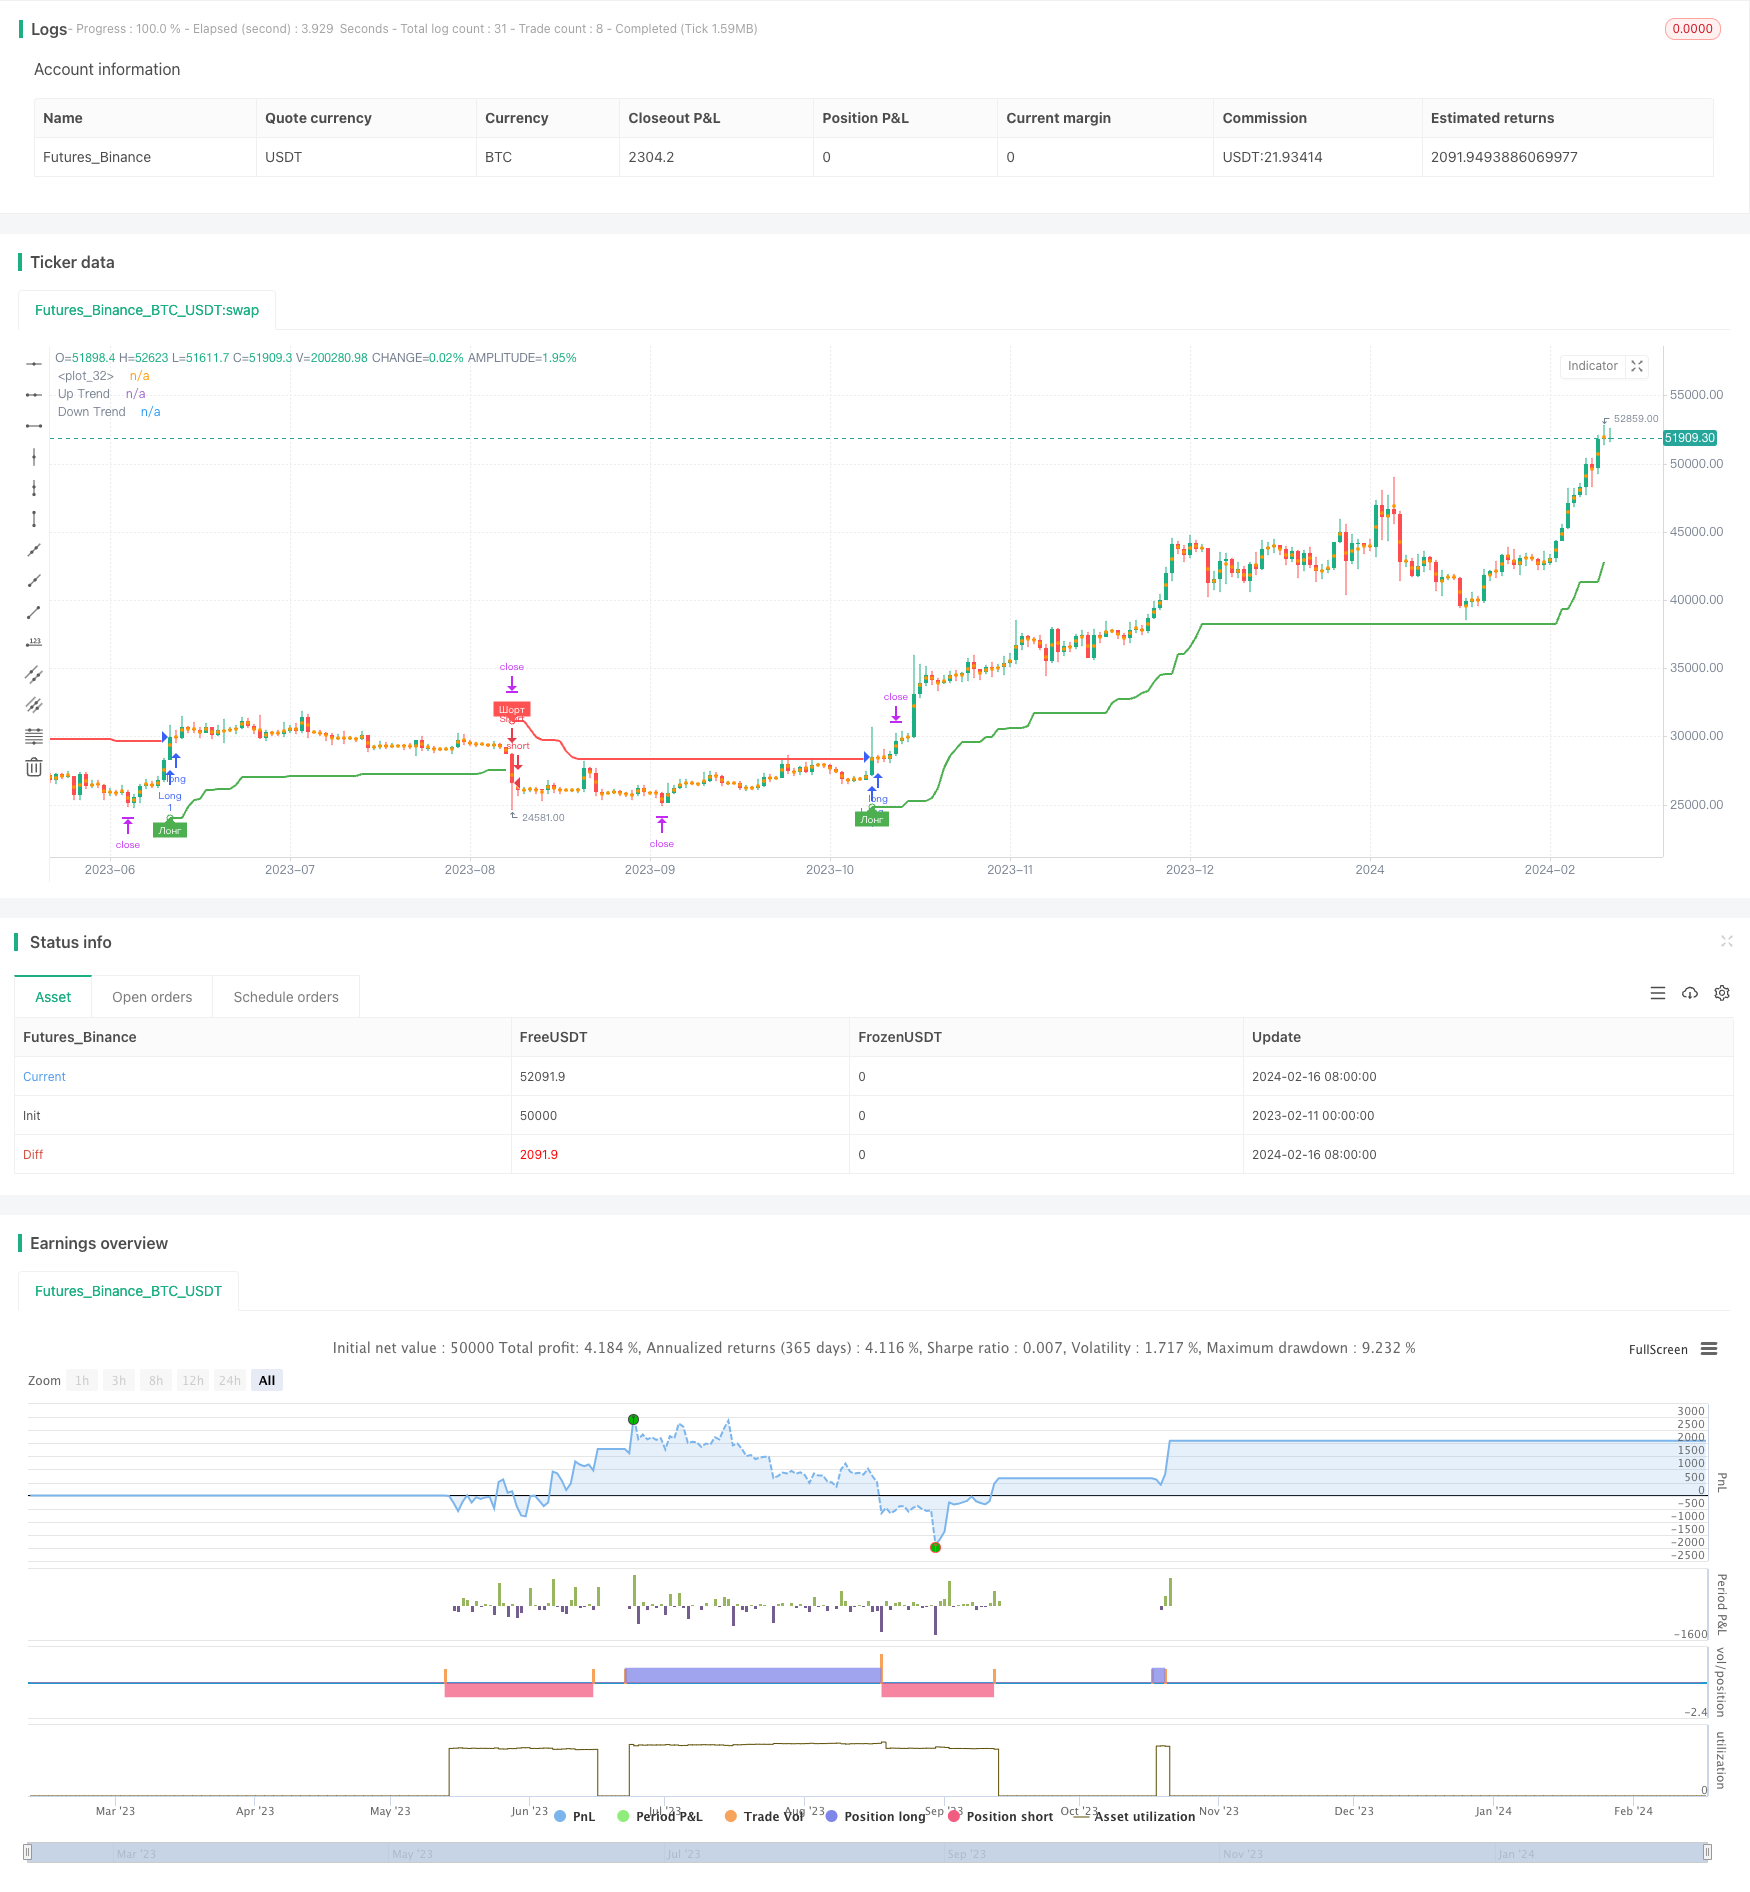
概述
该策略基于超级趋势通道指标开发。它结合价格行情以及超级趋势通道的方向,判断行情趋势,并在通道方向转折时发出交易信号。
当价格突破超级趋势通道时,买入做多;当价格跌破超级趋势下通道时,卖出做空。同时,它具有趋势跟踪止损机制。
策略原理
超级趋势通道由一上轨、一下轨组成。通道内部为盘整区域,通道外部为趋势区域。它利用平均真实波动范围乘以一个倍数,来确定通道的宽度。
当价格从下方突破上轨时,为买入信号。这意味着新的上涨趋势启动。当价格从上方跌破下轨时,为卖出信号。这意味着新的下跌趋势开始。
该策略运用超级趋势通道指标判断主要趋势的方向。当通道方向发生转折时,即价格突破通道轨时,发出交易信号;然后利用趋势跟踪止损方式,锁定盈利。
优势分析
这是一个较为简单直观的突破策略。它具有以下优势:
利用超级趋势通道判断主要趋势方向,避免被噪音iB赚钱。
顺势而为,根据价格与通道的关系判断做多做空时机。
具有清晰的止损机制,可以有效控制风险。
止损方式为趋势跟踪止损,可最大程度锁定盈利。
风险与改进
该策略也存在一些风险,主要包括:
超级趋势通道参数设置不当,可能导致虚假信号。
突破信号可能是短期的反转信号,从而产生亏损。
止损方式仅为趋势跟踪止损,可能会过早止损。
对应改进措施包括:
测试不同市场的数据,优化参数。
结合其他指标过滤信号。
结合价格 Structure,判断突破信号的可靠性。
增加后台止损,进一步控制风险。
总结
该策略整体而言是一个较为简单直观的趋势跟踪策略。它利用超级趋势通道清晰判断趋势方向,在通道发生转折时产生信号;然后利用趋势跟踪止损方式锁定盈利。
相比其他指标,超级趋势通道对价格波动的包容性较好。但该策略也存在一定盈利空间,可以从信号过滤及止损方式等方面进行优化,以进一步提高稳定性。
策略源码
/*backtest
start: 2023-02-11 00:00:00
end: 2024-02-17 00:00:00
period: 1d
basePeriod: 1h
exchanges: [{"eid":"Futures_Binance","currency":"BTC_USDT"}]
*/

//@version=4
strategy("Supertrend TEST Strategy", overlay = true, format=format.price, precision=2)

Periods = input(title="ATR Period", type=input.integer, defval=4)
src = input(hlc3, title="Source")
Multiplier = input(title="ATR Multiplier", type=input.float, step=0.1, defval=4.7)
changeATR= input(title="Change ATR Calculation Method ?", type=input.bool, defval=true)
showsignals = input(title="Show Buy/Sell Signals ?", type=input.bool, defval=true)
highlighting = input(title="Highlighter On/Off ?", type=input.bool, defval=true)
tp=close
sl=close

atr2 = sma(tr, Periods)
atr= changeATR ? atr(Periods) : atr2
up=src-(Multiplier*atr)
up1 = nz(up[1],up)
up := close[1] > up1 ? max(up,up1) : up
dn=src+(Multiplier*atr)
dn1 = nz(dn[1], dn)
dn := close[1] < dn1 ? min(dn, dn1) : dn
trend = 1
trend := nz(trend[1], trend)
trend := trend == -1 and close > dn1 ? 1 : trend == 1 and close < up1 ? -1 : trend
upPlot = plot(trend == 1 ? up : na, title="Up Trend", style=plot.style_linebr, linewidth=2, color=color.green)
buySignal = trend == 1 and trend[1] == -1
plotshape(buySignal ? up : na, title="UpTrend Begins", location=location.absolute, style=shape.circle, size=size.tiny, color=color.green )
plotshape(buySignal and showsignals ? up : na, title="Лонг", text="Лонг", location=location.absolute, style=shape.labelup, size=size.tiny, color=color.green, textcolor=color.white )
dnPlot = plot(trend == 1 ? na : dn, title="Down Trend", style=plot.style_linebr, linewidth=2, color=color.red)
sellSignal = trend == -1 and trend[1] == 1
plotshape(sellSignal ? dn : na, title="DownTrend Begins", location=location.absolute, style=shape.circle, size=size.tiny, color=color.red )
plotshape(sellSignal and showsignals ? dn : na, title="Шорт", text="Шорт", location=location.absolute, style=shape.labeldown, size=size.tiny, color=color.red, textcolor=color.white )
mPlot = plot(ohlc4, title="", style=plot.style_circles, linewidth=0)
longFillColor = highlighting ? (trend == 1 ? color.green : color.white) : color.white
shortFillColor = highlighting ? (trend == -1 ? color.red : color.white) : color.white


if (strategy.position_size > 0)
	tp:=tp[1]
	sl:=up
	strategy.exit("Long_TP/SL","Long",limit=tp, stop=sl)

if (strategy.position_size < 0)
	tp:=tp[1]
	sl:=dn
	strategy.exit("Short_TP/SL","Short",limit=tp, stop=sl)


if buySignal
	tp:=close+(close-up)*0.382
    strategy.entry("Long", strategy.long,  limit=tp, comment=tostring(round(tp)))
if sellSignal
	tp:=close-(dn-close)*0.382
    strategy.entry("Short", strategy.short, limit=tp, comment=tostring(round(tp)))