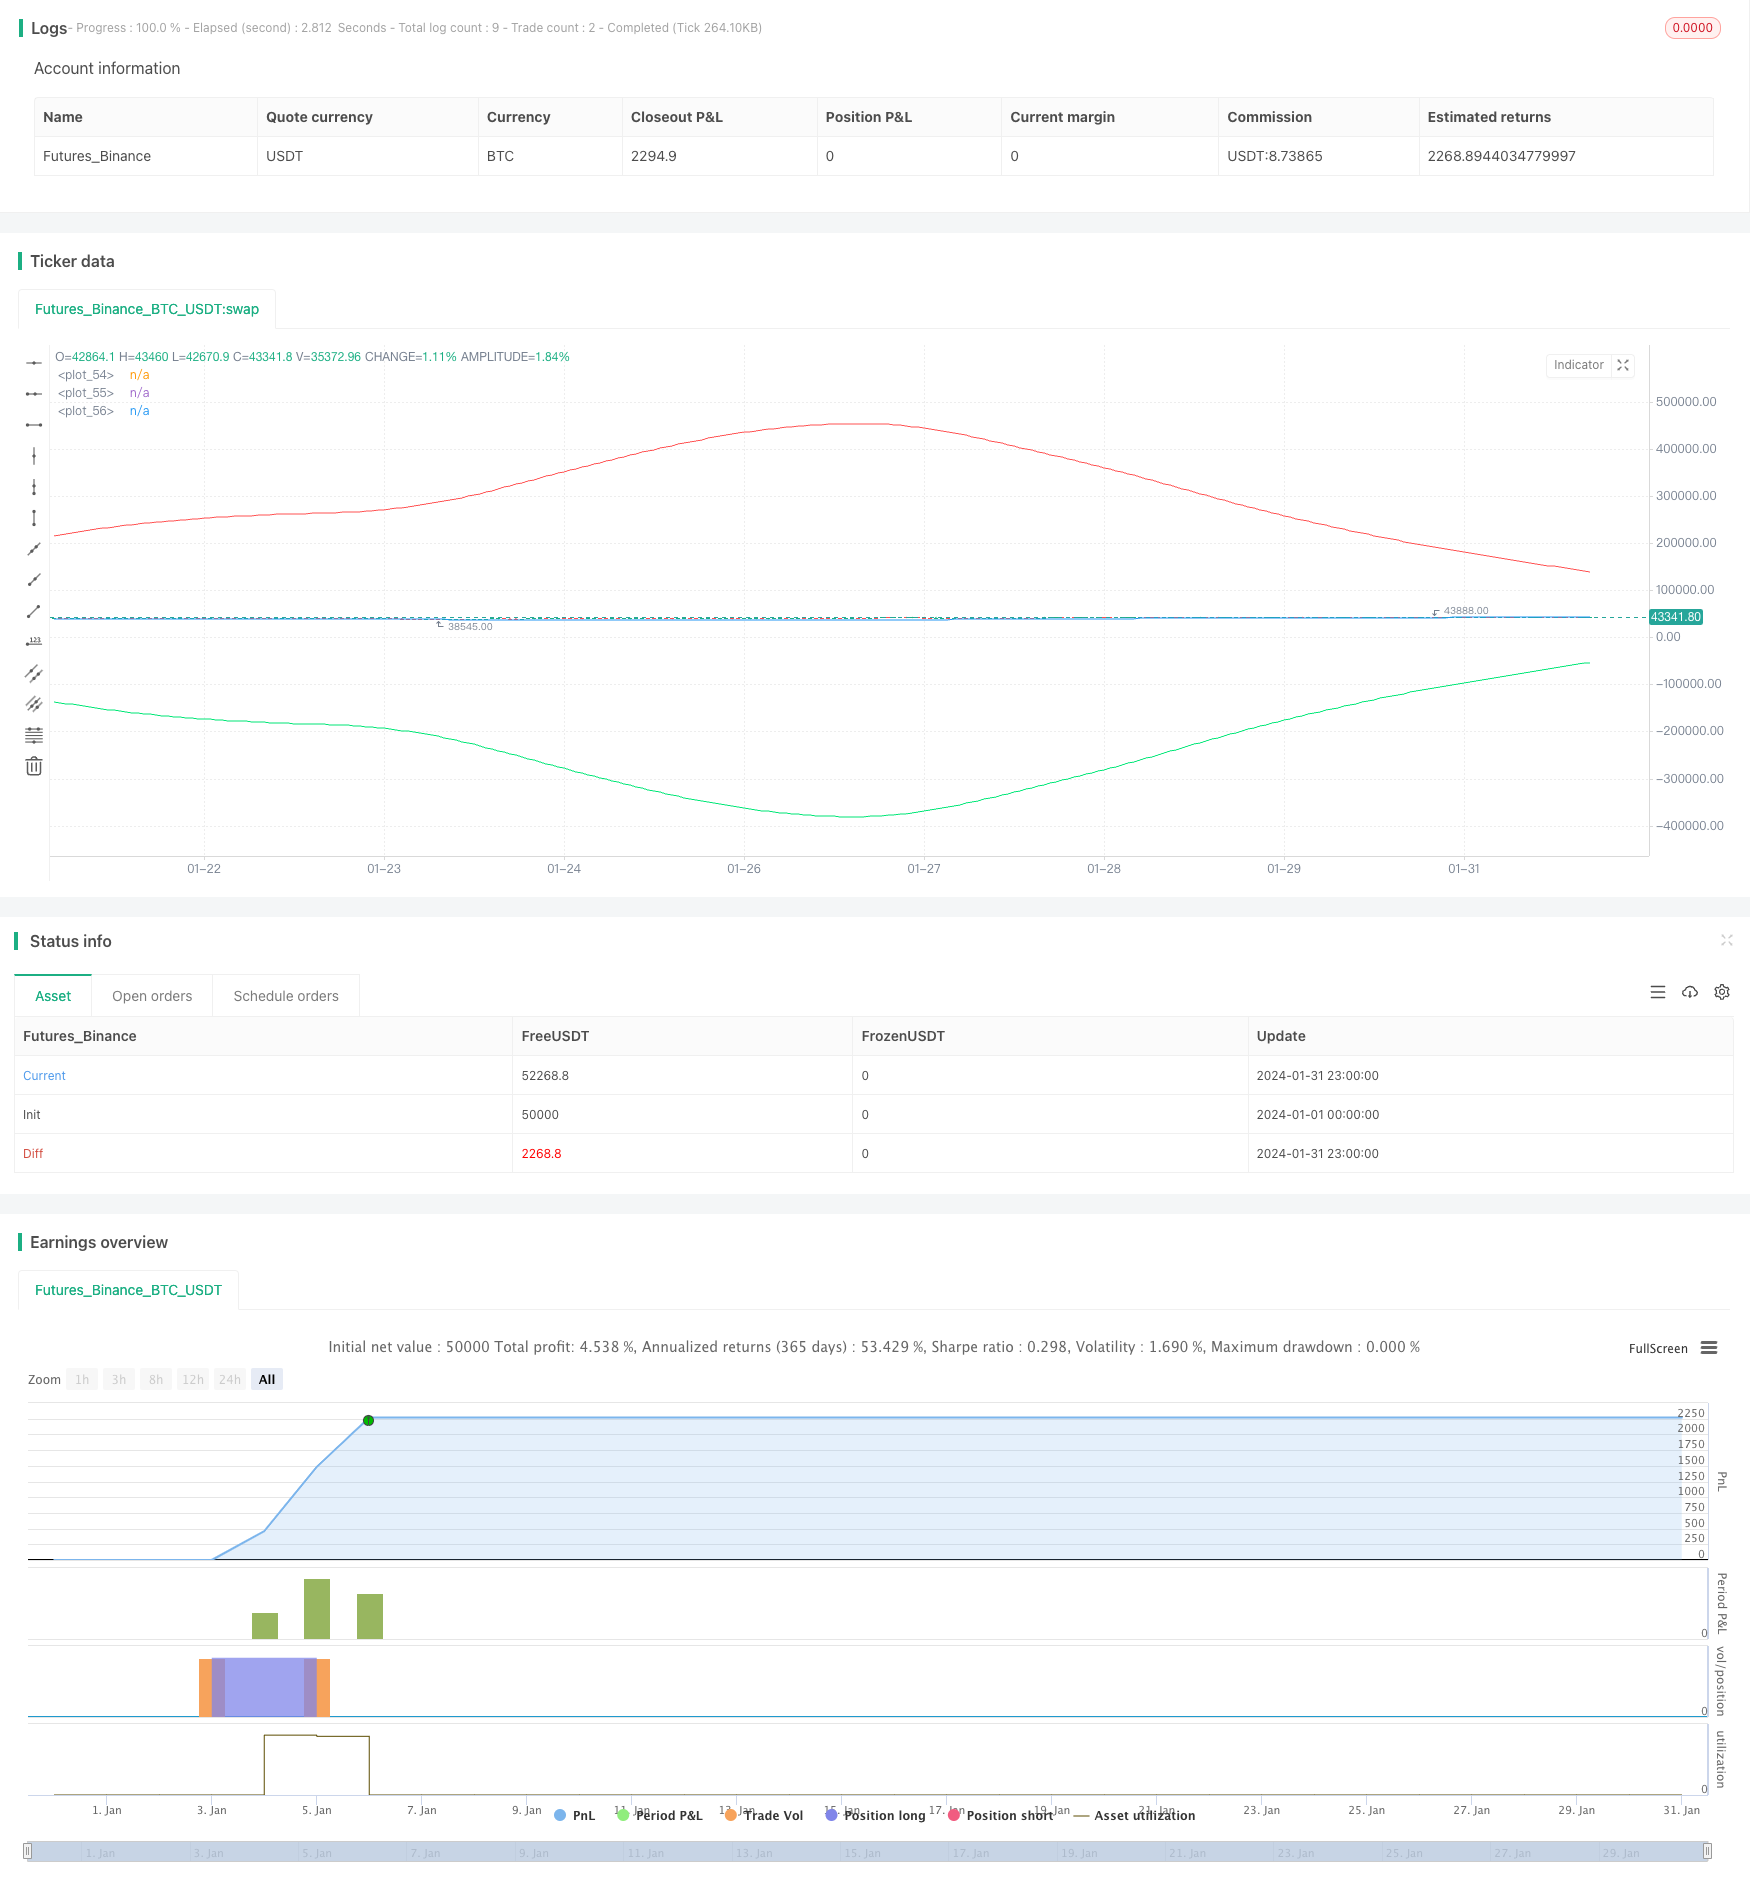
概述
该策略利用线性回归通道的上下轨,结合双标准差设置突破买入和卖出信号,实现价格突破后开仓建立头寸。同时利用通道中线的交叉作为平仓信号,实现盈利后止盈。
策略原理
该策略的核心逻辑基于线性回归通道的上下轨以及中线。具体计算过程如下:
计算价格的线性回归值linreg,以及下一周期的线性回归值linreg_p
根据线性回归值计算线性回归线的斜率slope和截距intercept
计算价格相对于回归线的偏差deviation
设置偏差的倍数dev,得到上轨、下轨的偏移量
当价格从下轨向上突破时,设置买入信号buy
当价格从上轨向下突破时,设置卖出信号sell
当价格从通道中线反转时,设置止盈信号exit
根据买入信号、卖出信号和止盈信号设置交易逻辑
优势分析
该策略最大的优势在于利用了线性回归通道所反映的价格中长期趋势。具体体现在以下几个方面:
线性回归通道的上下轨可以有效反映价格波动的正常范围,利用通道范围设置交易信号,可以减少错误信号。
中线交叉作为止盈信号,可以最大限度锁定盈利,避免盈利后继续反转带来的亏损。
线性回归通道具有一定的滞后性,可以有效滤除短期市场噪音,使交易信号更加可靠。
该策略参数较少,容易实现,适合量化交易的算法化。
风险分析
该策略也存在一些风险,主要体现在:
线性回归通道具有滞后性,可能错过短期急剧变化后的趋势。可以适当缩短通道周期,优化参数。
偏差倍数设定不当也会导致错误信号。可以结合回测优化参数。
仅基于突破信号,可能较多出现震荡亏损。可以考虑结合其他指标进行滤波。
存在一定的曲线拟合风险。可以考虑与其他通道指标结合,或者测试不同数据源。
优化方向
该策略主要可以从以下几个方面进行优化:
优化线性回归通道的长度,平衡滞后性和反应灵敏度。
优化偏差倍数,在最大限度控制风险的前提下,提高信号质量。
增加其他指标进行信号过滤,提高策略胜率。例如EMA,KDJ等。
增加止损机制。例如ATR止损,跟踪止损等。
测试不同数据源对策略的影响。例如使用复权数据,指数数据等。
结合市场环境(多空头市)动态调整参数或信号权重。
总结
该策略整体来说是一个利用线性回归通道作为信号指标的突破系统。策略思路清晰易懂,参数较少,实盘实施难度不大。但如何根据市场环境动态优化调整参数,结合其他指标进行信号过滤,是该策略成功的关键。通过不断测试和优化,该策略可以成为一个稳定盈利的量化系统。
/*backtest
start: 2024-01-01 00:00:00
end: 2024-01-31 23:59:59
period: 1h
basePeriod: 15m
exchanges: [{"eid":"Futures_Binance","currency":"BTC_USDT"}]
*/

//Robotrading
//@version=4

strategy("robotrading linreg", "linreg", overlay=true, default_qty_type = strategy.percent_of_equity, default_qty_value = 10, commission_value = 0.1)

//Settings
source      = input(close)
length      = input(100, minval=1)
offset      = input(0, minval=0)
dev         = input(2.0, "Deviation")
smoothing   = input(1, minval=1)
mtf_val     = input("", "Resolution", input.resolution)
signals     = input("Recent", "Signals Display", options=["Recent", "All"])
goto        = input(0, "End At Bar Index")

//Lin.reg.
cc(x) => x=="Red"?color.red:x=="Lime"?color.lime:x=="Orange"?color.orange:x=="Teal"?color.teal:x=="Yellow"?color.yellow:x=="Black"?color.black:color.white
data(x) => sma(security(syminfo.tickerid, mtf_val!="" ? mtf_val : timeframe.period, x), smoothing)
linreg = data(linreg(source, length, offset))
linreg_p = data(linreg(source, length, offset+1))

//Deviation
x = bar_index
slope = linreg - linreg_p
intercept = linreg - x*slope
deviationSum = 0.0
for i = 0 to length-1
    deviationSum:= deviationSum + pow(source[i]-(slope*(x-i)+intercept), 2)
deviation = sqrt(deviationSum/(length))
x1 = x-length
x2 = x
y1 = slope*(x-length)+intercept
y2 = linreg

//Cross
dm_current = -deviation*dev + y2
dp_current = deviation*dev + y2
ex_current = (dm_current + dp_current) / 2
buy = crossunder(close, dm_current)
sell = crossover(close, dp_current)
exit = crossover(close, ex_current) or crossunder(close, ex_current)

//Channel
updating = goto <= 0 or x < goto
// if updating
//     line b = line.new(x1, y1, x2, y2, xloc.bar_index, extend.right, color.aqua, width = 3)
//     line.delete(b[1])
//     line dp = line.new(x1, deviation*dev + y1, x2, deviation*dev + y2, xloc.bar_index, extend.right, color.red, width = 3)
//     line.delete(dp[1])
//     line dm = line.new(x1, -deviation*dev + y1, x2, -deviation*dev + y2, xloc.bar_index, extend.right, color.lime, width = 3)
//     line.delete(dm[1])

//Lines
plot(dm_current, color = color.lime)
plot(dp_current, color = color.red)
plot(ex_current)

//Trading
if ex_current > 0
    strategy.entry("Long", strategy.long, na, limit = dm_current)
    strategy.entry("Short", strategy.short, na, limit = dp_current)
    strategy.exit("ExitLong", "Long", limit = ex_current)
    strategy.exit("ExitShort", "Short", limit = ex_current)