Dual Moving Average Trading Strategy

Overview
This strategy generates trading signals by using dual moving averages. It sends buy signals when the short-term moving average crosses above the long-term moving average, and sell signals when the reverse happens. This strategy combines the trend-following capability of moving averages to effectively catch price trends and implement trend trading.
Strategy Logic
This strategy leverages two exponential moving averages (EMA) with different periods. EMA1 is the short-term MA with a period set to 9, while EMA2 is the long-term MA with the period set to 21. The strategy generates buy signals when the EMA1 crosses above EMA2, and sell signals when it crosses below.
By doing so, the strategy utilizes the trend-tracking capability of moving averages to capture signals when price starts a new trending direction. For example, when the price bounces up from a drop, the short-term MA would rally earlier than the long-term MA. The crossing above generates an early signal that the uptrend begins.
Pros
The biggest strength of this strategy lies in its capability to effectively identify price trends, especially suitable for markets with strong trending tendencies. Moving averages themselves have great trend-following features, and the dual MA mechanism further improves it. Also, comparing to single MA strategies, dual MAs can filter out more false signals and improve reliability.
Cons
The biggest risk is that when prices fluctuate dramatically, the lagging nature of MAs may lead to missing best entry or exit points. Also, when markets consolidate in ranges, there can be more invalid signals and lower stability of the strategy.
To mitigate the risks, parameters like MA periods can be adjusted accordingly, or additional filters can be added. For example, combining volatility index to set a threshold and avoid trading in highly volatile conditions.
Enhancement
The optimization space mainly lies in the following aspects:
- Optimize MA period parameters to find the optimal combination
- Add other indicators as filters to improve signal reliability
- Setup adaptive parameters according to different products and market regimes
- Combine volume indicators to determine precise entry points
- Optimize stop loss mechanisms
Summary
This strategy generates signals by dual exponential moving averages, with strength in price trend tracking capability to detect trend reversals. But limitations like MA lag do exist. Next step would be enhancing signal quality, entry timing and stop loss from various dimensions.
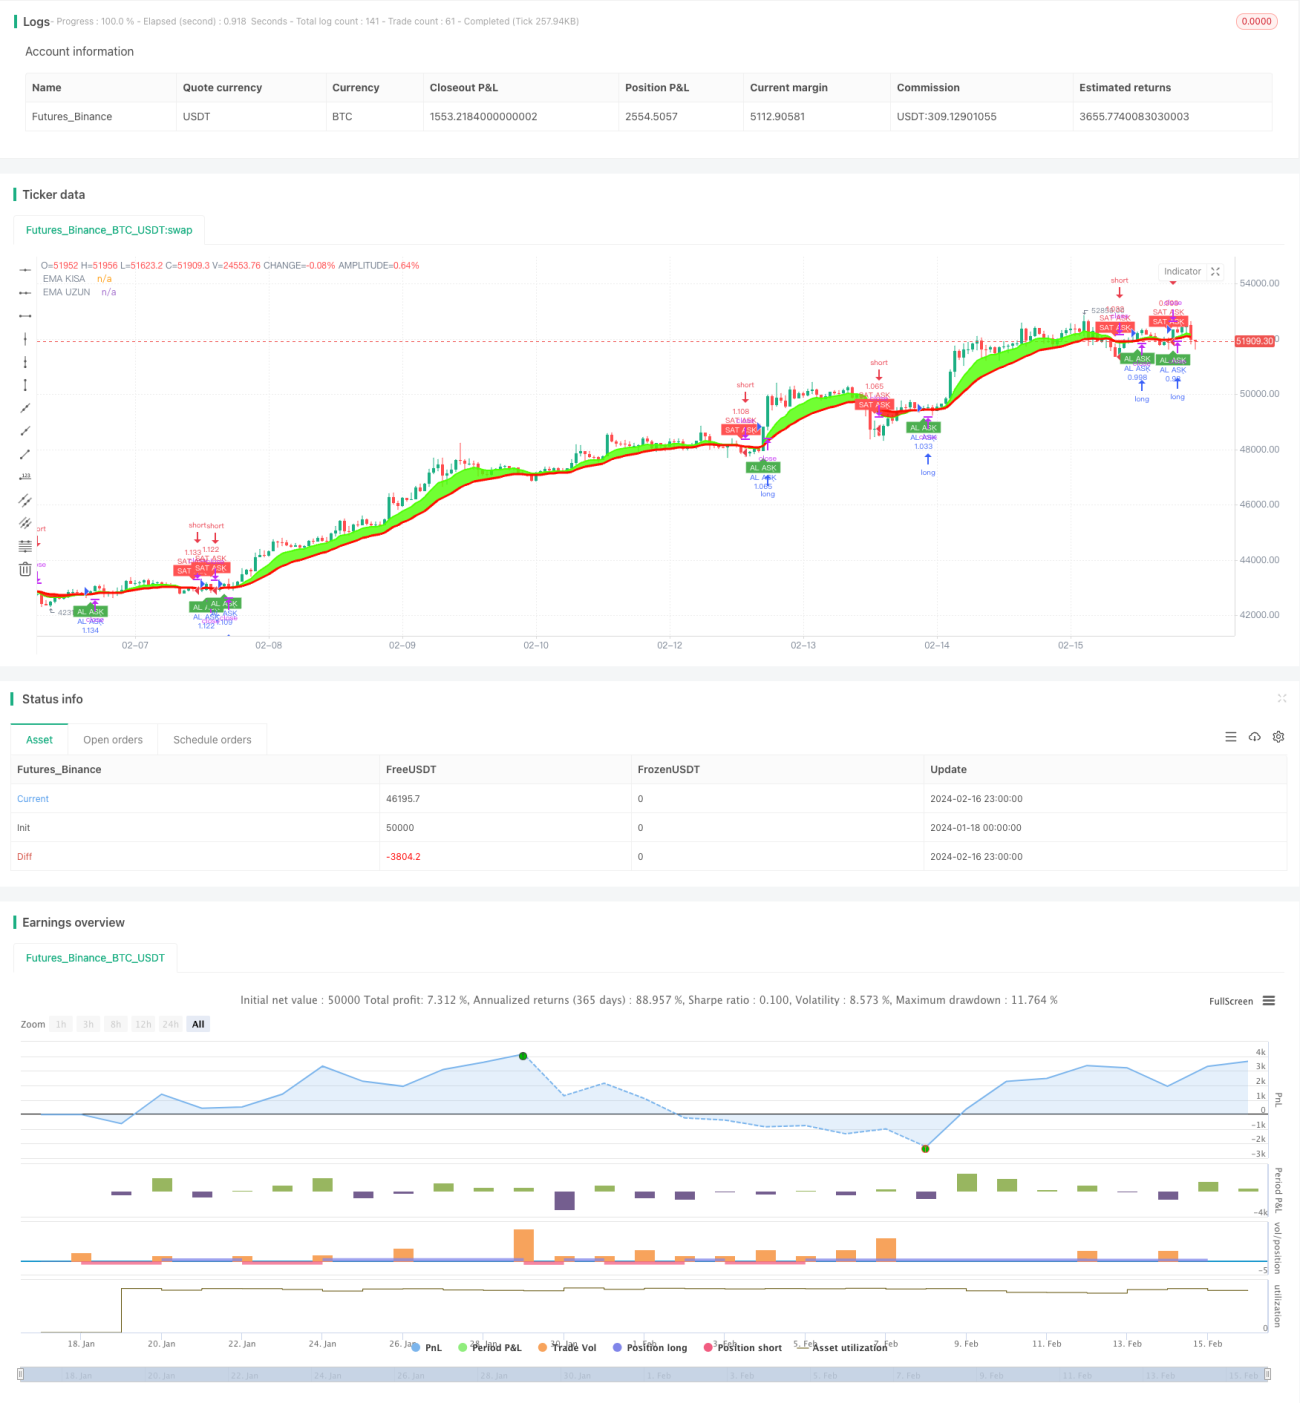
/*backtest
start: 2024-01-18 00:00:00
end: 2024-02-17 00:00:00
period: 1h
basePeriod: 15m
exchanges: [{"eid":"Futures_Binance","currency":"BTC_USDT"}]
*/

// This Pine Script™ code is subject to the terms of the Mozilla Public License 2.0 at https://mozilla.org/MPL/2.0/
// © technicalTruff99446

//@version=4- 1